Skip to content
  • About
  • Methodology
  • Deaths vs vaccination
  • Excess mortality
  • Comparisons
  • Analysis
  • Research
COVID-19 graphs & analysis
  • Daily updates
    • Cumulative deaths per million
    • Daily deaths & 7d avg
    • Daily cases & 7d avg
    • Combined deaths & cases
    • Select a country
  • Analysis
    • Covid-19 pandemic: Daily confirmed cases per country
    • Covid-19 pandemic: Cumulative deaths per million per country for Europe & USA [+ video!]. Daily updated
    • Covid-19 pandemic: Daily deaths per country
    • 2nd wave impact. Daily deaths now vs. max of period Feb-Jun.
    • Development of 7-day avg deaths per month from February to 4th November.
    • Covid-19 cases and deaths: graphs updated for multiple countries (up to 13th Nov 2020)
    • Covid-19 cases & deaths graphs update for 42 countries
    • Video: z-score per week in Europe
  • Comparisons
    • Deaths per million vs percentage of fully vaccination [for 41 European countries]
    • Select a country of your choice
    • Combined graphs (cases + deaths) per country.
  • Research
    • Scientists say that people who have recovered from COVID-19 may not have developed antibodies for SARS-CoV-2 virus
    • Excess mortality in the UK & the US
    • SARS-COV-2 infection is likely to be androgen mediated (scientific paper)
    • South Korean expert explains it all about SARS-CoV-2
  • About
  • Toggle website search
Menu Close
  • Daily updates
    • Cumulative deaths per million
    • Daily deaths & 7d avg
    • Daily cases & 7d avg
    • Combined deaths & cases
    • Select a country
  • Analysis
    • Covid-19 pandemic: Daily confirmed cases per country
    • Covid-19 pandemic: Cumulative deaths per million per country for Europe & USA [+ video!]. Daily updated
    • Covid-19 pandemic: Daily deaths per country
    • 2nd wave impact. Daily deaths now vs. max of period Feb-Jun.
    • Development of 7-day avg deaths per month from February to 4th November.
    • Covid-19 cases and deaths: graphs updated for multiple countries (up to 13th Nov 2020)
    • Covid-19 cases & deaths graphs update for 42 countries
    • Video: z-score per week in Europe
  • Comparisons
    • Deaths per million vs percentage of fully vaccination [for 41 European countries]
    • Select a country of your choice
    • Combined graphs (cases + deaths) per country.
  • Research
    • Scientists say that people who have recovered from COVID-19 may not have developed antibodies for SARS-CoV-2 virus
    • Excess mortality in the UK & the US
    • SARS-COV-2 infection is likely to be androgen mediated (scientific paper)
    • South Korean expert explains it all about SARS-CoV-2
  • About
  • Toggle website search
  • About
  • Methodology
  • Deaths vs vaccination
  • Excess mortality
  • Comparisons
  • Analysis
  • Research

Analysis

  1. Home>
  2. Analysis

Covid-19 pandemic: Daily confirmed cases per country

  • Post author:admin_covid
  • Post published:28 February 2021
  • Post category:Analysis/Comparisons
  • Post comments:0 Comments
Read more about the article Covid-19 pandemic: Daily confirmed cases per country

Since Feb-21, this page is automatically updated on a daily basis. All of them, plus MORE country graphs can be found here.

Continue ReadingCovid-19 pandemic: Daily confirmed cases per country

Covid-19 pandemic: Daily deaths per country

  • Post author:admin_covid
  • Post published:25 February 2021
  • Post category:Analysis/Comparisons
  • Post comments:2 Comments
Read more about the article Covid-19 pandemic: Daily deaths per country

Since Feb-21, this page is automatically updated on a daily basis. All of them, plus MORE country graphs can be found here.

Continue ReadingCovid-19 pandemic: Daily deaths per country

2nd wave impact. Daily deaths now vs. max of period Feb-Jun.

  • Post author:admin_covid
  • Post published:2 December 2020
  • Post category:Analysis/Comparisons
  • Post comments:0 Comments
Read more about the article 2nd wave impact. Daily deaths now vs. max of period Feb-Jun.

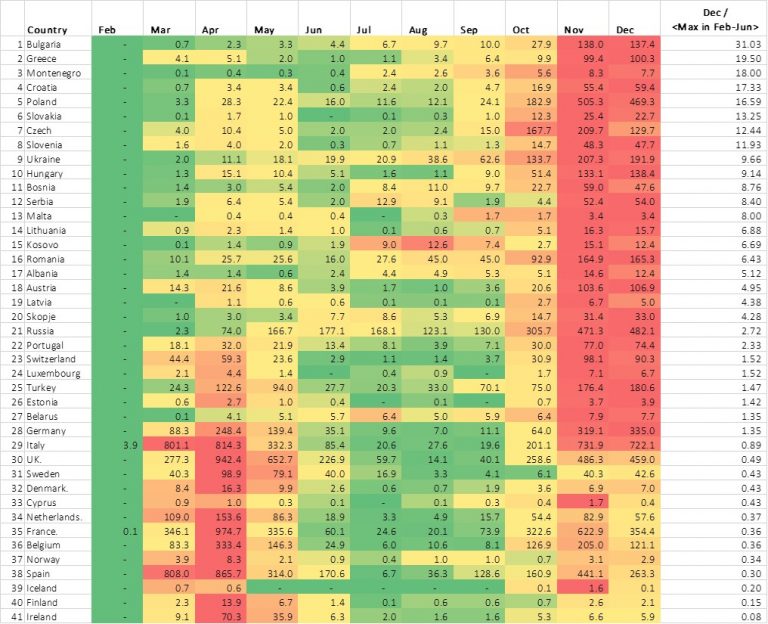
Update: 8.12.2020 Max of <daily deaths / day> for each month and European country. Final column: latest value / max of <Feb-Jun> to implicitly measure the magnitude of second wave…

Continue Reading2nd wave impact. Daily deaths now vs. max of period Feb-Jun.

Development of 7-day avg deaths per month from February to 4th November.

  • Post author:admin_covid
  • Post published:5 November 2020
  • Post category:Analysis/Comparisons
  • Post comments:3 Comments
Read more about the article Development of 7-day avg deaths per month from February to 4th November.

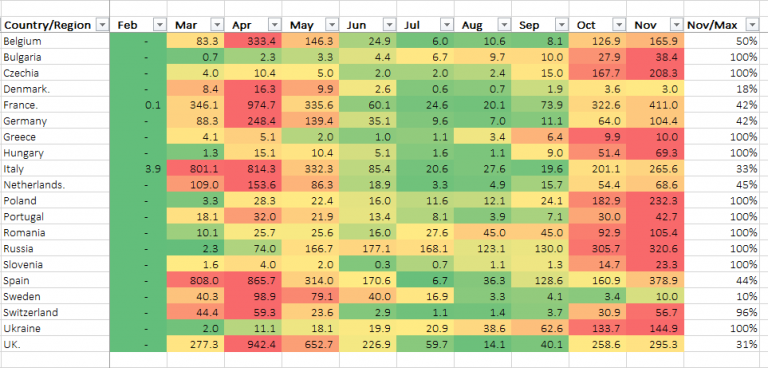
All values represent the maximum value per month of the 7-day moving average of daily deaths per country. No scaling per population, just plain daily deaths, from the official announcements…

Continue ReadingDevelopment of 7-day avg deaths per month from February to 4th November.

Covid-19 cases and deaths: graphs updated for multiple countries (up to 13th Nov 2020)

  • Post author:admin_covid
  • Post published:21 October 2020
  • Post category:Analysis/Comparisons
  • Post comments:0 Comments
Read more about the article Covid-19 cases and deaths: graphs updated for multiple countries (up to 13th Nov 2020)

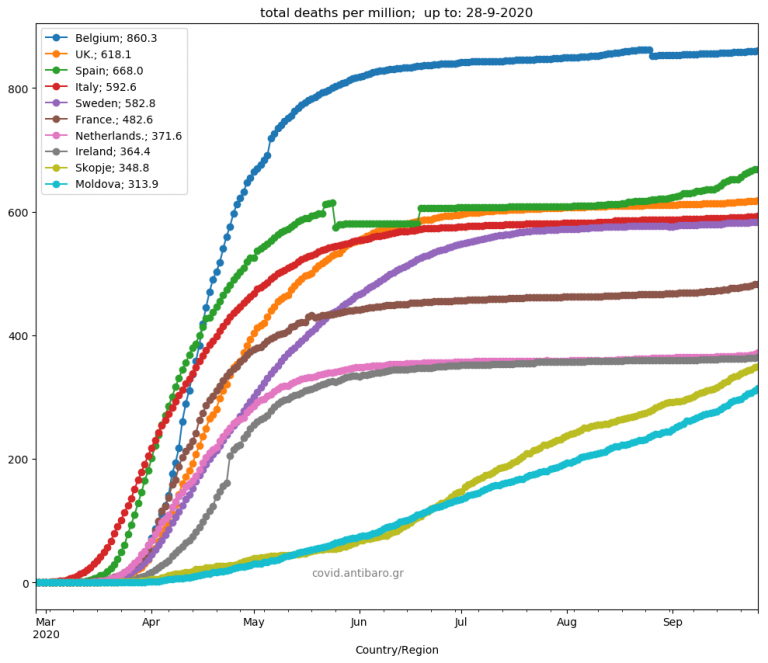
Data up to 13th Nov 2020 Daily deaths plus 7-day average for many countries in alphabetical order. Blue is the daily value, orange is the 7-day moving average. In the…

Continue ReadingCovid-19 cases and deaths: graphs updated for multiple countries (up to 13th Nov 2020)

Covid-19 cases & deaths graphs update for 42 countries

  • Post author:admin_covid
  • Post published:30 September 2020
  • Post category:Analysis/Comparisons
  • Post comments:0 Comments
Read more about the article Covid-19 cases & deaths graphs update for 42 countries

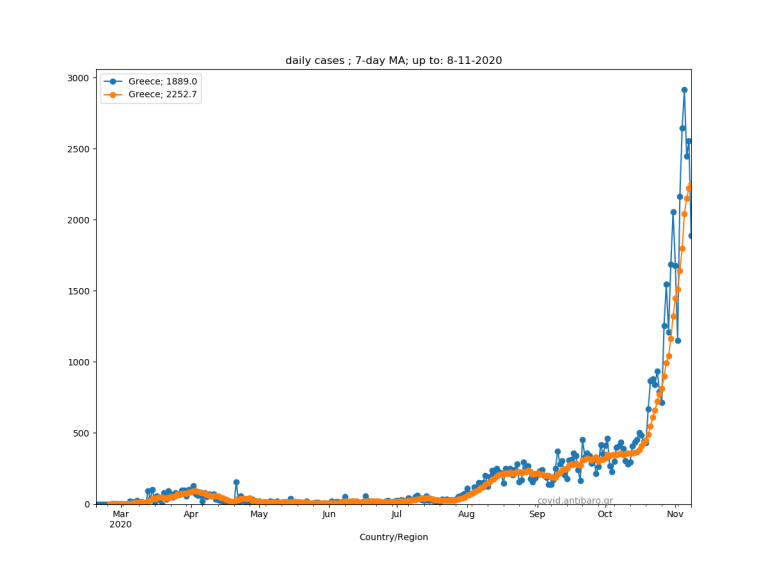
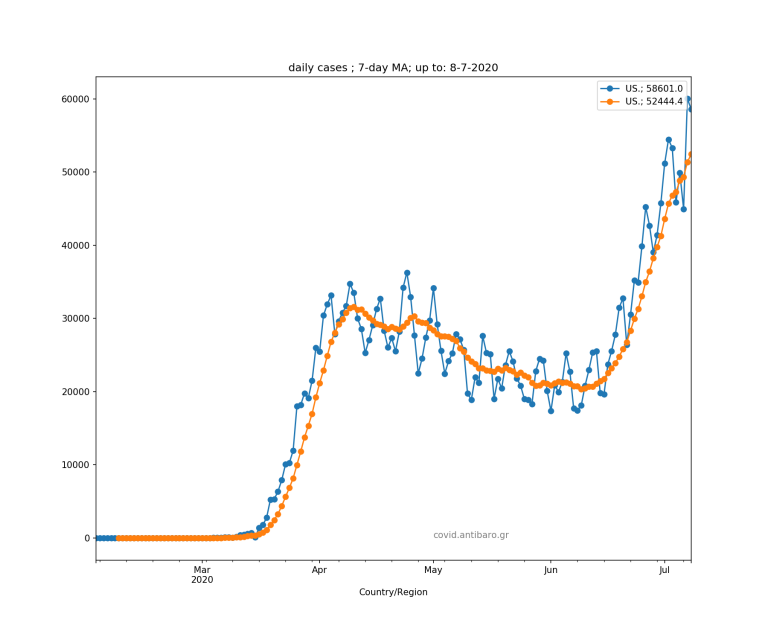
Update: 29th Sep 2020 Major update after a coupe of months. Daily confirmed cases plus 7-day average for 42 countries in alphabetical order. Blue is the daily value, orange is…

Continue ReadingCovid-19 cases & deaths graphs update for 42 countries

Updated graphs as of 8th July 2020 for various countries

  • Post author:admin_covid
  • Post published:9 July 2020
  • Post category:Analysis/Comparisons
  • Post comments:14 Comments
Read more about the article Updated graphs as of 8th July 2020 for various countries

Two sets of graphs for a variety of countries. Focus now on daily new cases, including 7 day average, and also on daily new deaths, again including 7-day average All…

Continue ReadingUpdated graphs as of 8th July 2020 for various countries

Video with graps development, including European top-40. Data, up to 17.5

  • Post author:admin_covid
  • Post published:18 May 2020
  • Post category:Analysis
  • Post comments:16 Comments

Enjoy the latest video https://www.youtube.com/watch?v=VkSobfvBGS0 https://www.youtube.com/watch?v=VkSobfvBGS0

Continue ReadingVideo with graps development, including European top-40. Data, up to 17.5

Video: z-score per week in Europe

  • Post author:admin_covid
  • Post published:16 May 2020
  • Post category:Analysis
  • Post comments:14 Comments

Here, I have made a video using their data for all the weeks in 2020. Euromomo website publishes z-score of deaths since 2015.

Continue ReadingVideo: z-score per week in Europe

VIDEO! COVID-19 graphs analysis of deaths/million per country

  • Post author:admin_covid
  • Post published:13 May 2020
  • Post category:Analysis
  • Post comments:12 Comments

Video with daily graphs for various countries on the virus outbreak expansion in different countries. Estimation of lags behind Italy per country. Intersection at 6 deaths per million. Various daily…

Continue ReadingVIDEO! COVID-19 graphs analysis of deaths/million per country
  • 1
  • 2
  • Go to the next page

Latest graph

Latest in UK-Greece-US


Book: The Ultimate Chess Guide

Recent Posts

  • Deaths per million vs percentage of fully vaccination [for 41 European countries] 4 November 2021
  • Select a country of your choice 7 March 2021
  • Combined graphs (cases + deaths) per country. 6 March 2021
  • Covid-19 pandemic: Daily confirmed cases per country 28 February 2021
  • Covid-19 pandemic: Cumulative deaths per million per country for Europe & USA [+ video!]. Daily updated 25 February 2021
  • Covid-19 pandemic: Daily deaths per country 25 February 2021
  • 2nd wave impact. Daily deaths now vs. max of period Feb-Jun. 2 December 2020
  • Development of 7-day avg deaths per month from February to 4th November. 5 November 2020
  • Covid-19 cases and deaths: graphs updated for multiple countries (up to 13th Nov 2020) 21 October 2020
  • Covid-19 cases & deaths graphs update for 42 countries 30 September 2020
  • Updated graphs as of 8th July 2020 for various countries 9 July 2020
  • Development over time of daily [confirmed cases] and [deaths]; various countries 8 June 2020
  • Video with graps development, including European top-40. Data, up to 17.5 18 May 2020
  • Video: z-score per week in Europe 16 May 2020
  • VIDEO! COVID-19 graphs analysis of deaths/million per country 13 May 2020

Categories

  • Analysis
  • Comparisons
  • Research

Recent Comments

  • damski_komplekti_bhEi on Covid-19 pandemic. Spain vs Belgium.
  • damski_komplekti_thEi on Deaths per million vs percentage of fully vaccination [for 41 European countries]
  • web page on Covid-19 spread daily graph
  • damski_komplekti_yuEi on COVID-19 spread in 10 Balkan countries: Update 20.4.2020
  • damski_komplekti_vfEi on Top 20 countries in covid-19 spread

Meta

  • Log in
  • Entries feed
  • Comments feed
  • WordPress.org
  • About
  • Methodology
  • Deaths vs vaccination
  • Excess mortality
  • Comparisons
  • Analysis
  • Research