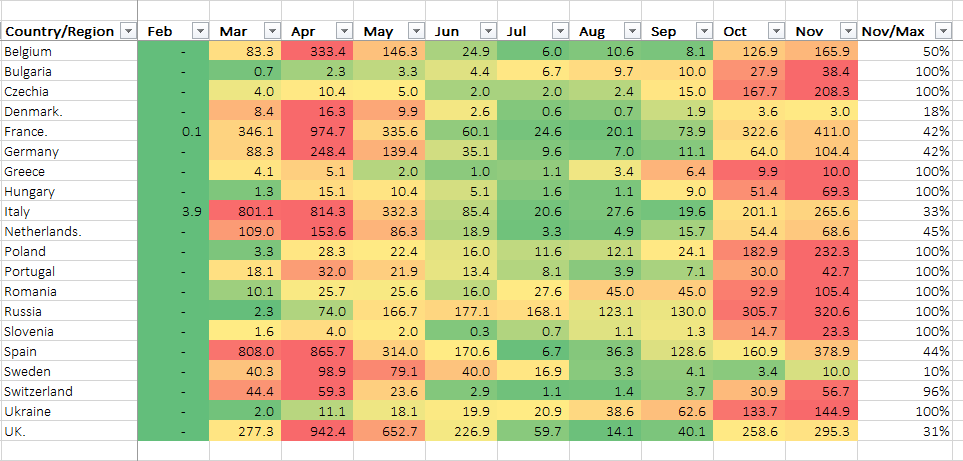
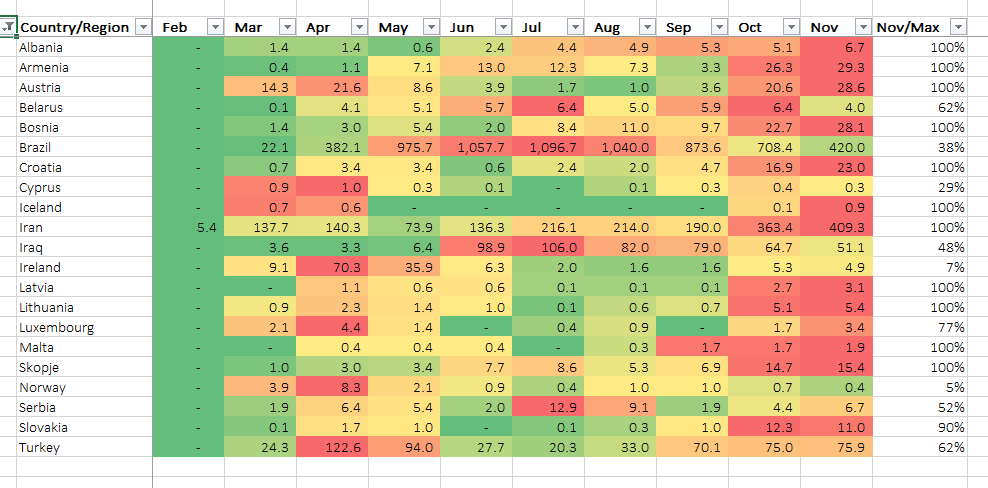
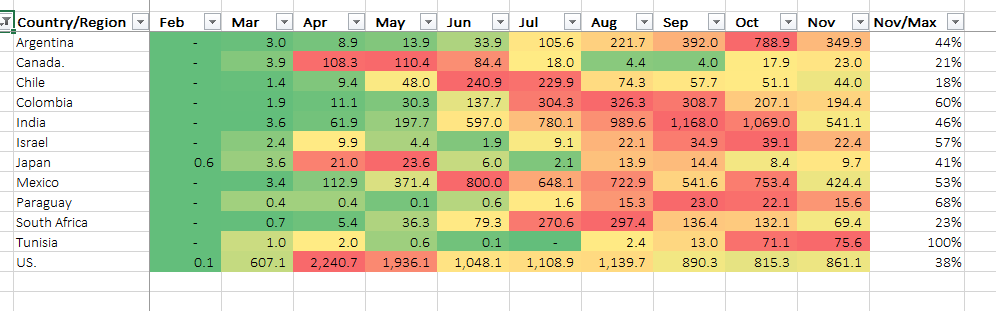
All values represent the maximum value per month of the 7-day moving average of daily deaths per country. No scaling per population, just plain daily deaths, from the official announcements of each country.
The colouring provide a quick and easy way to visually understand the trend.
The last column is the percentage of the latest value (7-d avg in November) over the maximum over the entire period Feb-Nov. So, the values of 100% mean that the maximum is in November 2020.
Update 9th Nov 2020
Highest value of 7-DAY AVERAGE DAILY DEATHS per month


Previous update (4th Nov 2020)
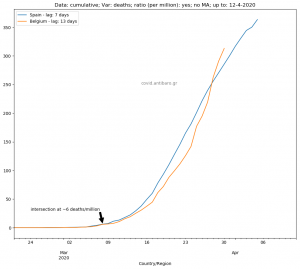
![Read more about the article Covid-19 pandemic: Cumulative deaths per million per country for Europe & USA [+ video!]. Daily updated](https://covid.antibaro.gr/wp-content/uploads/2020/12/covid-graph-detail-300x147.jpg)