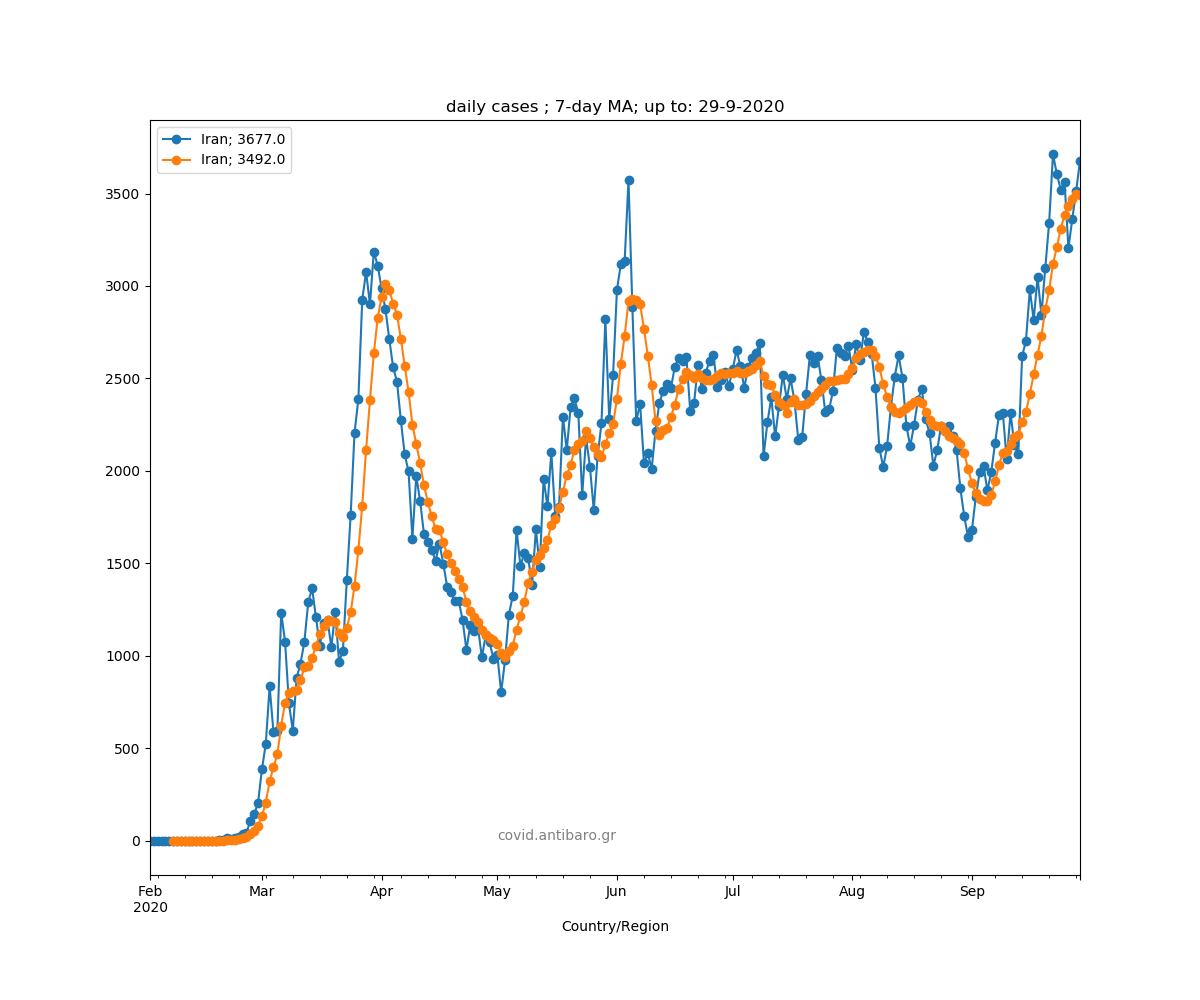
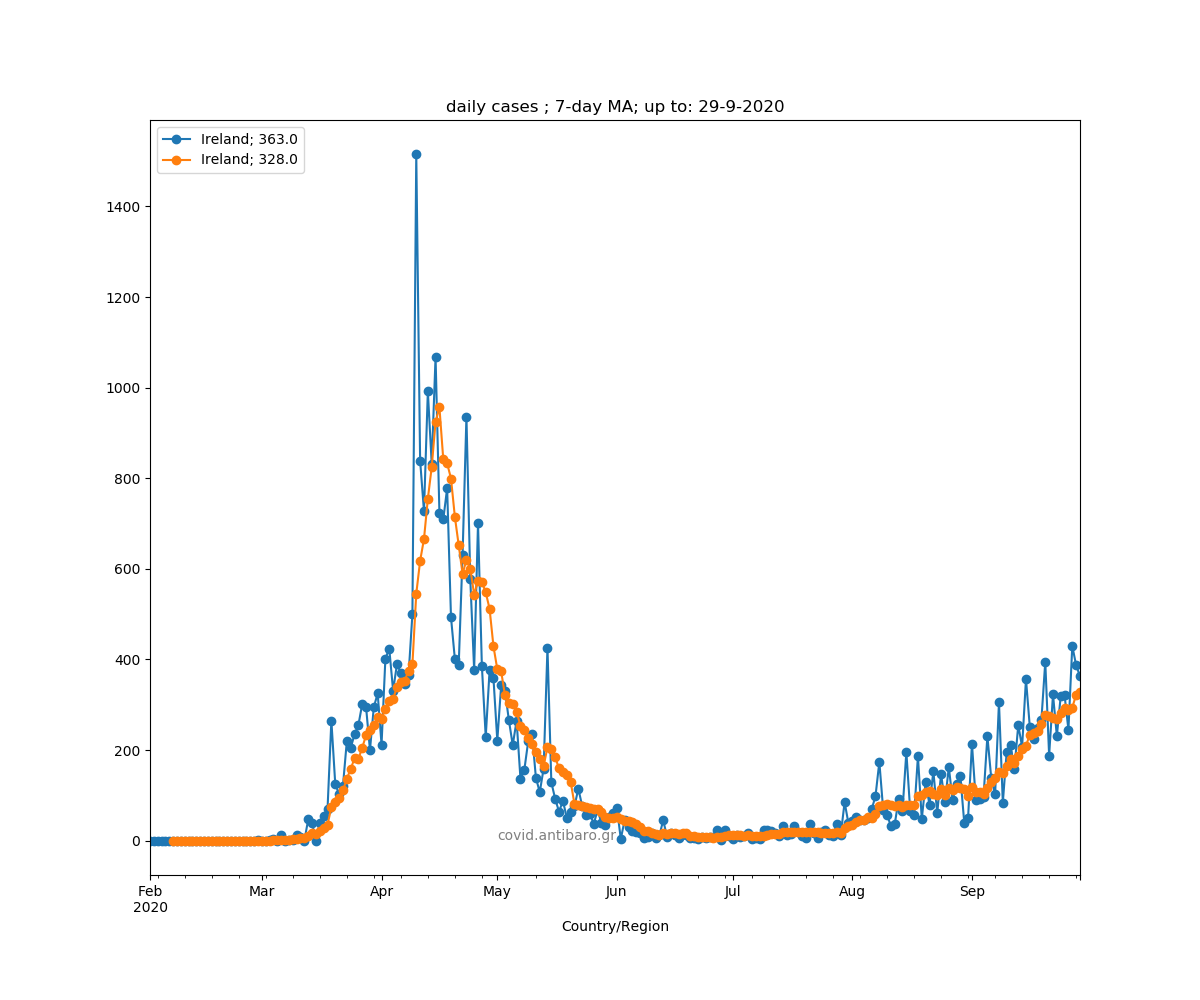
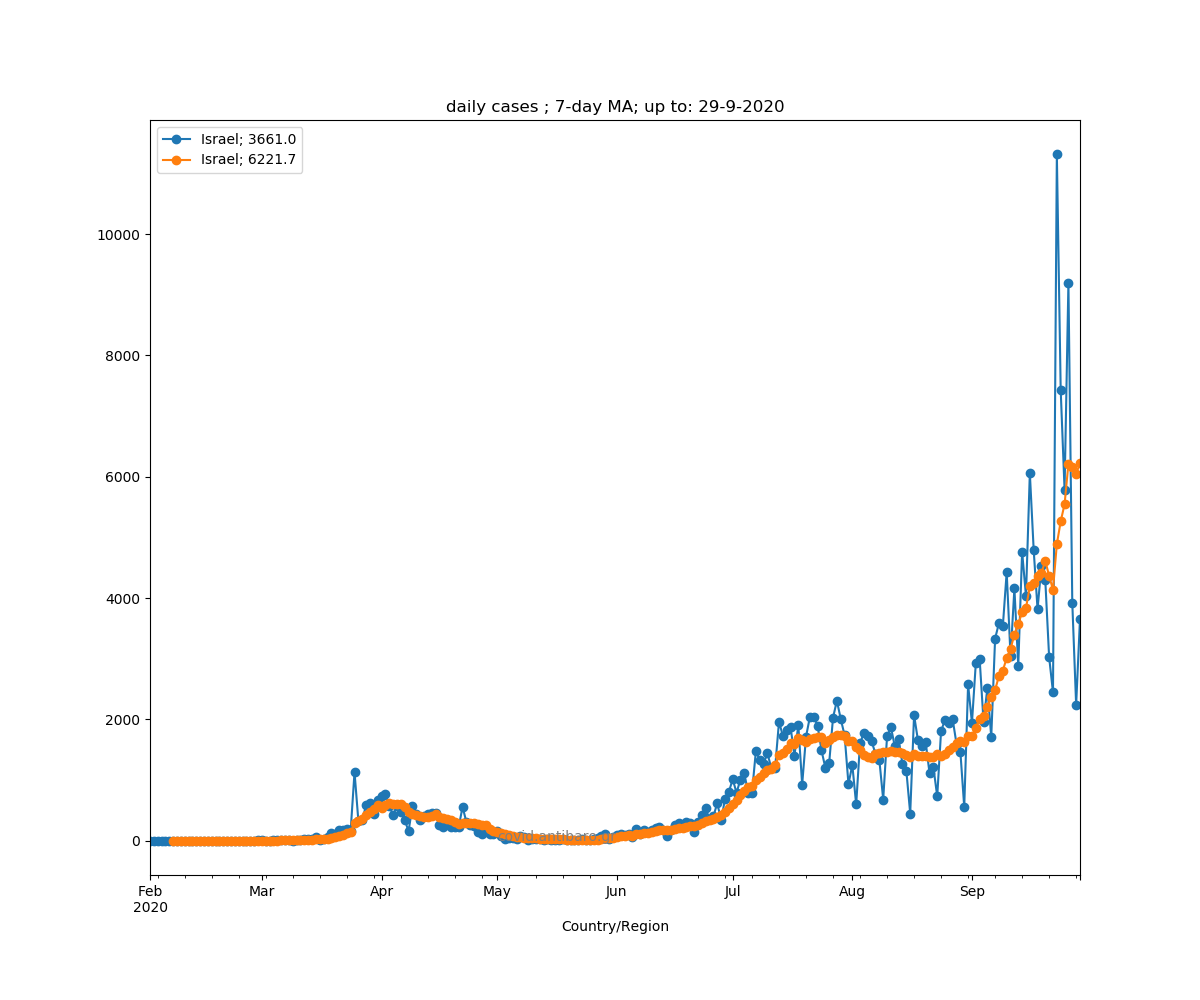
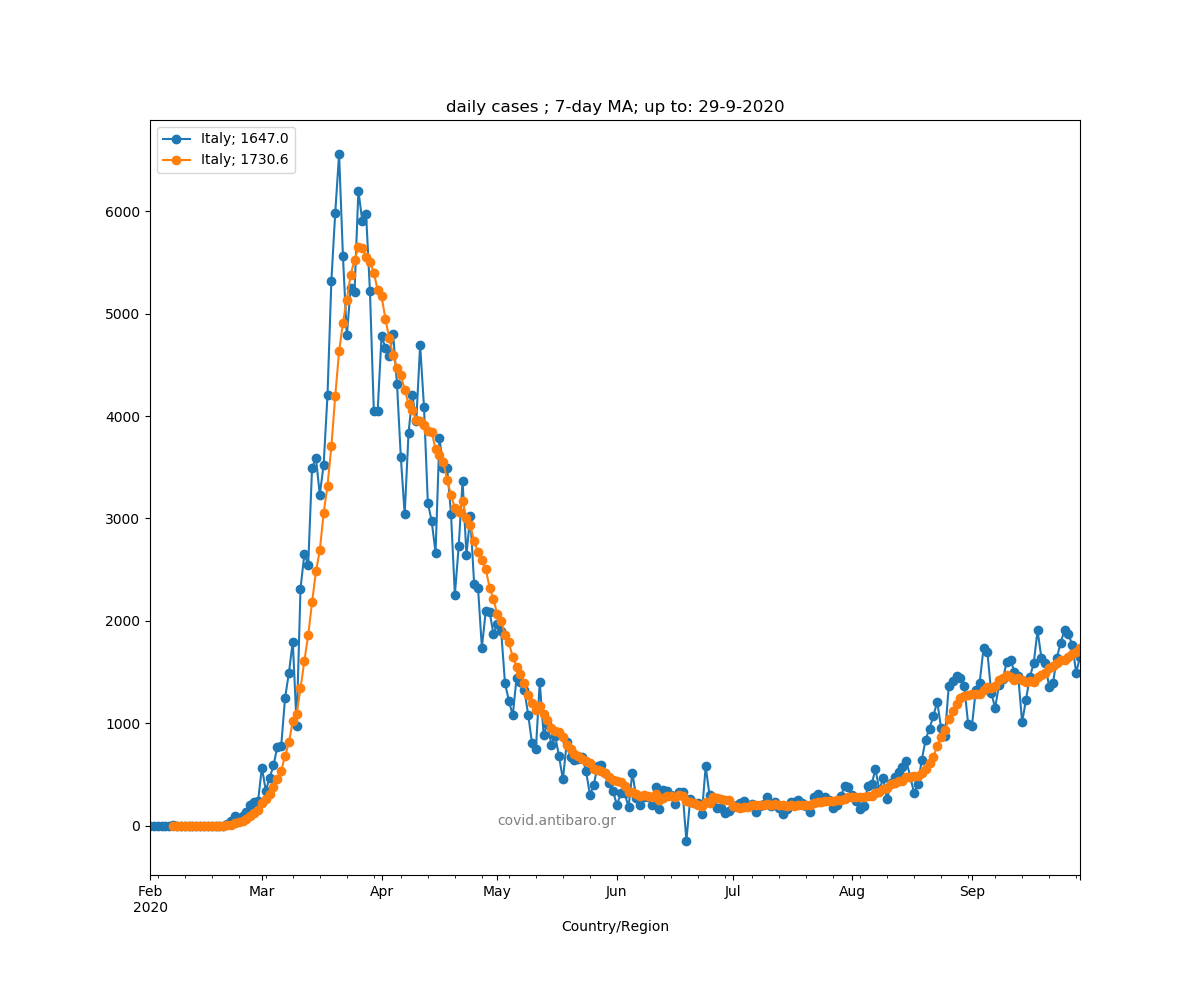
Update: 29th Sep 2020
Major update after a coupe of months.
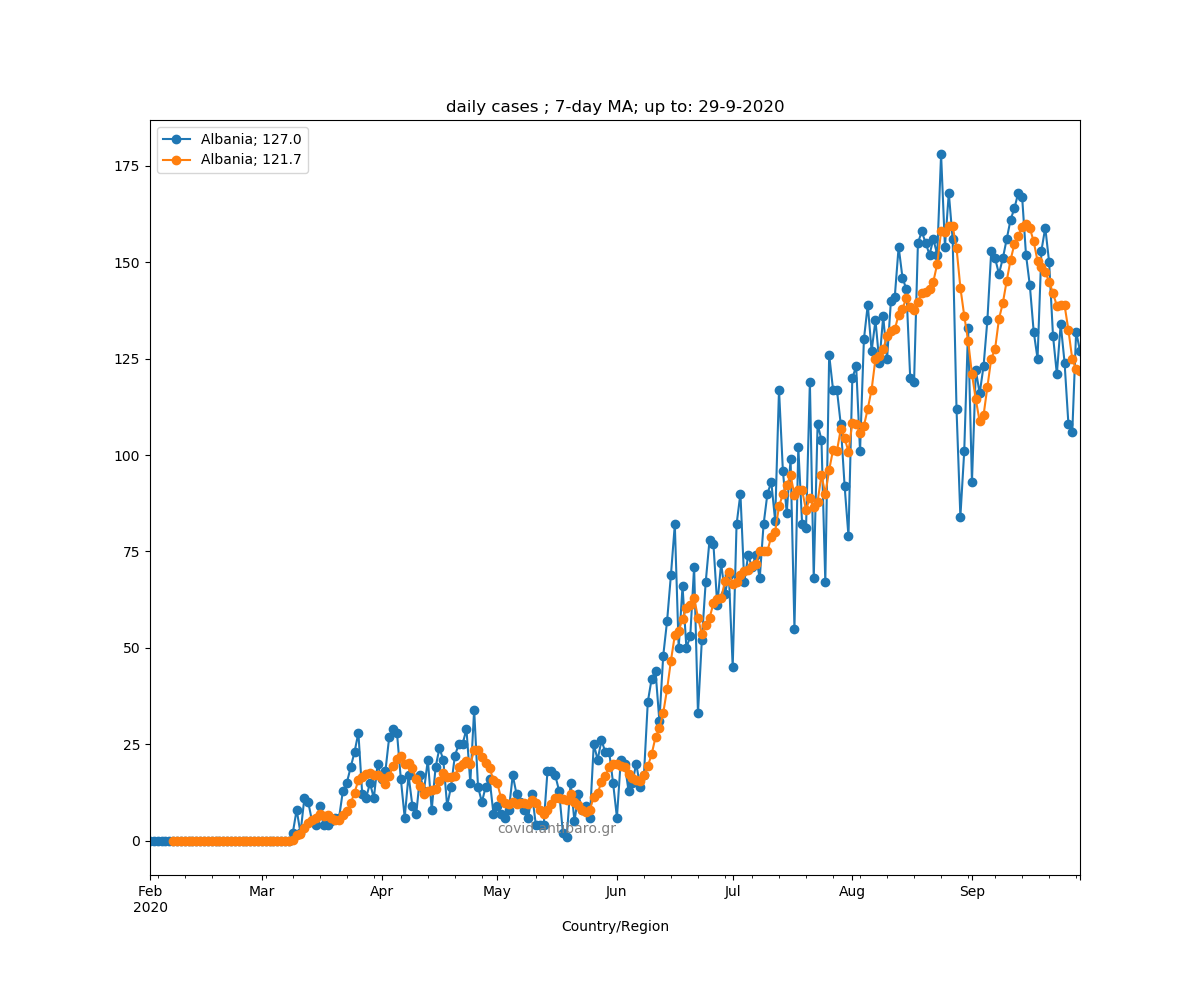
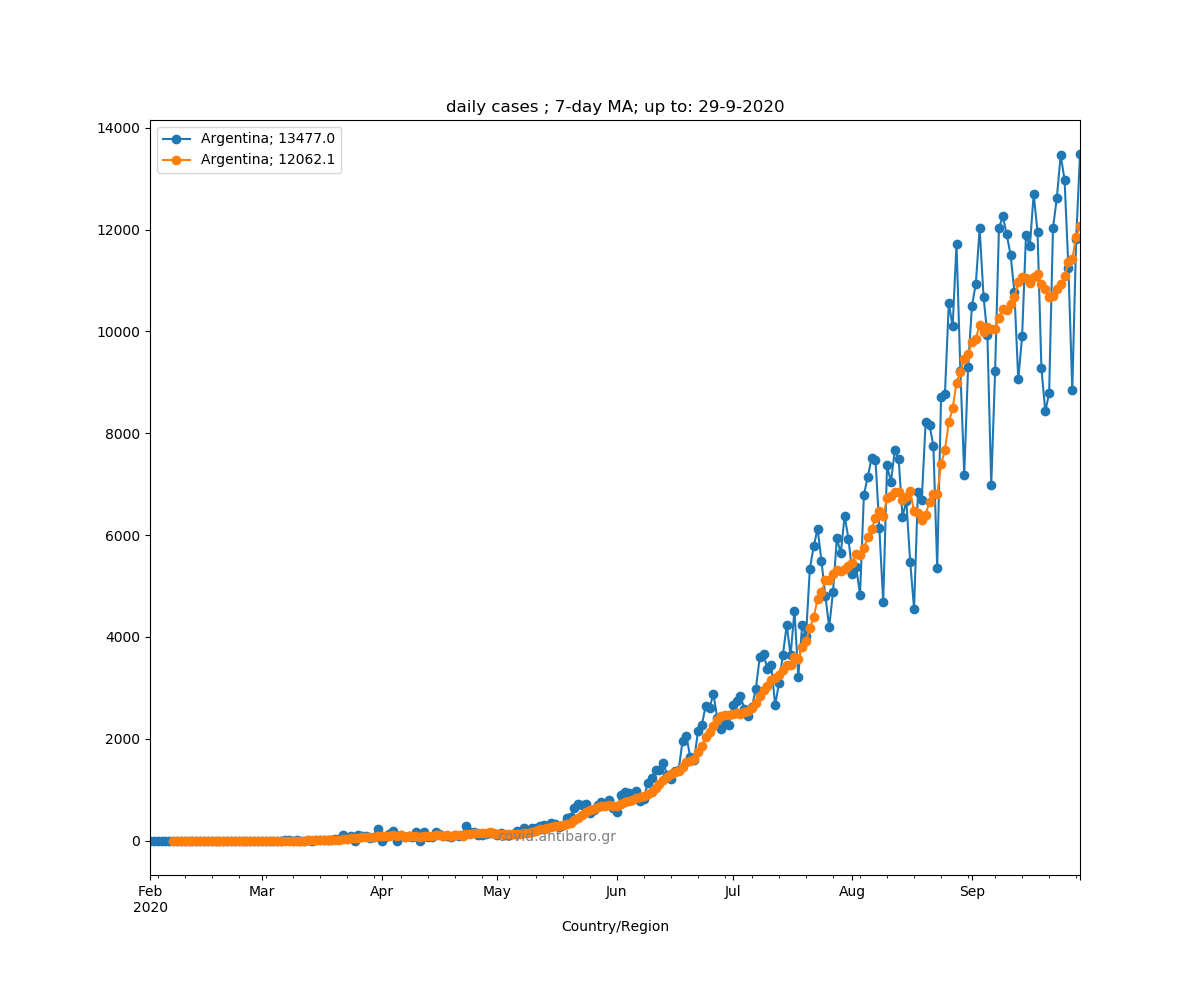
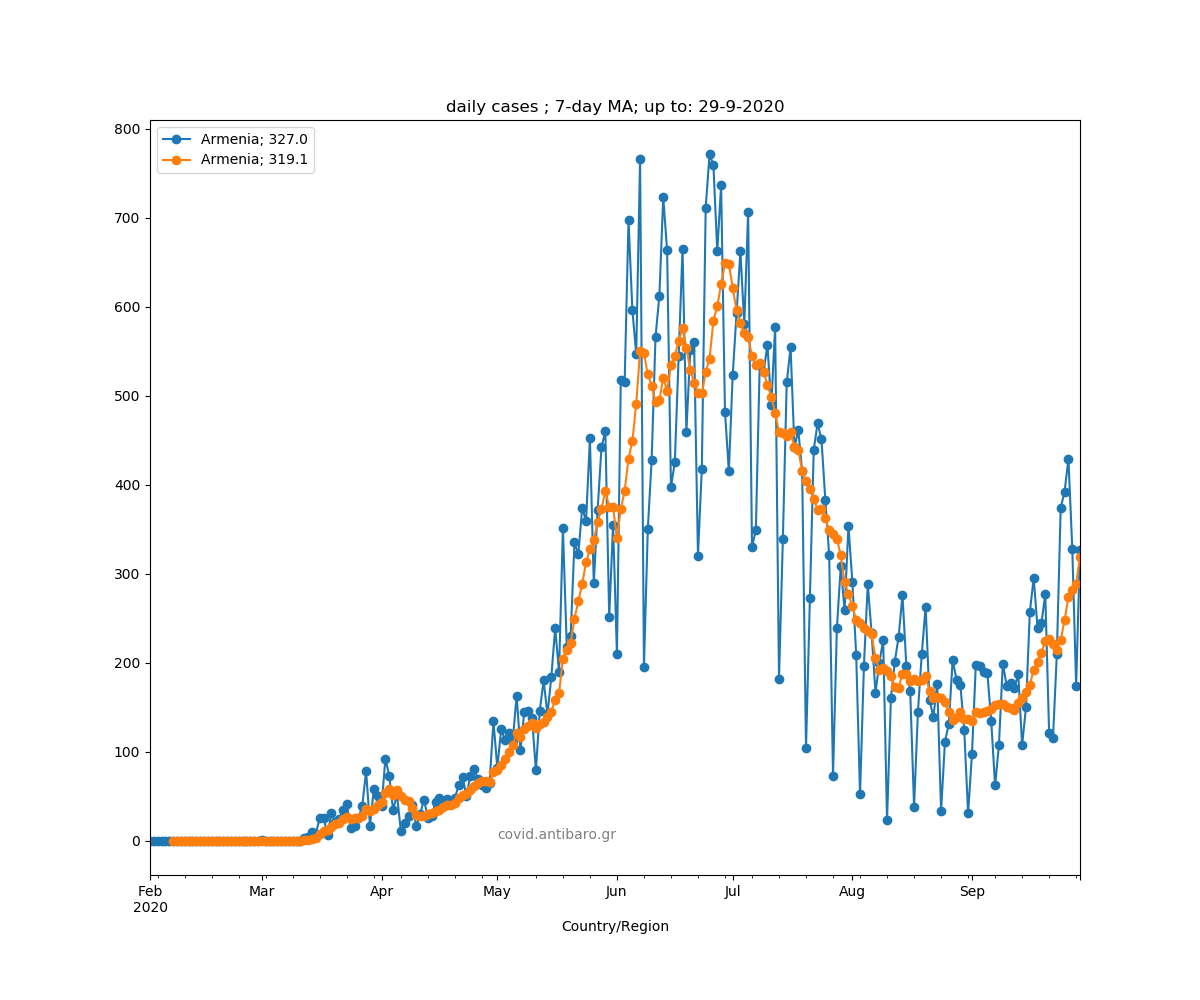
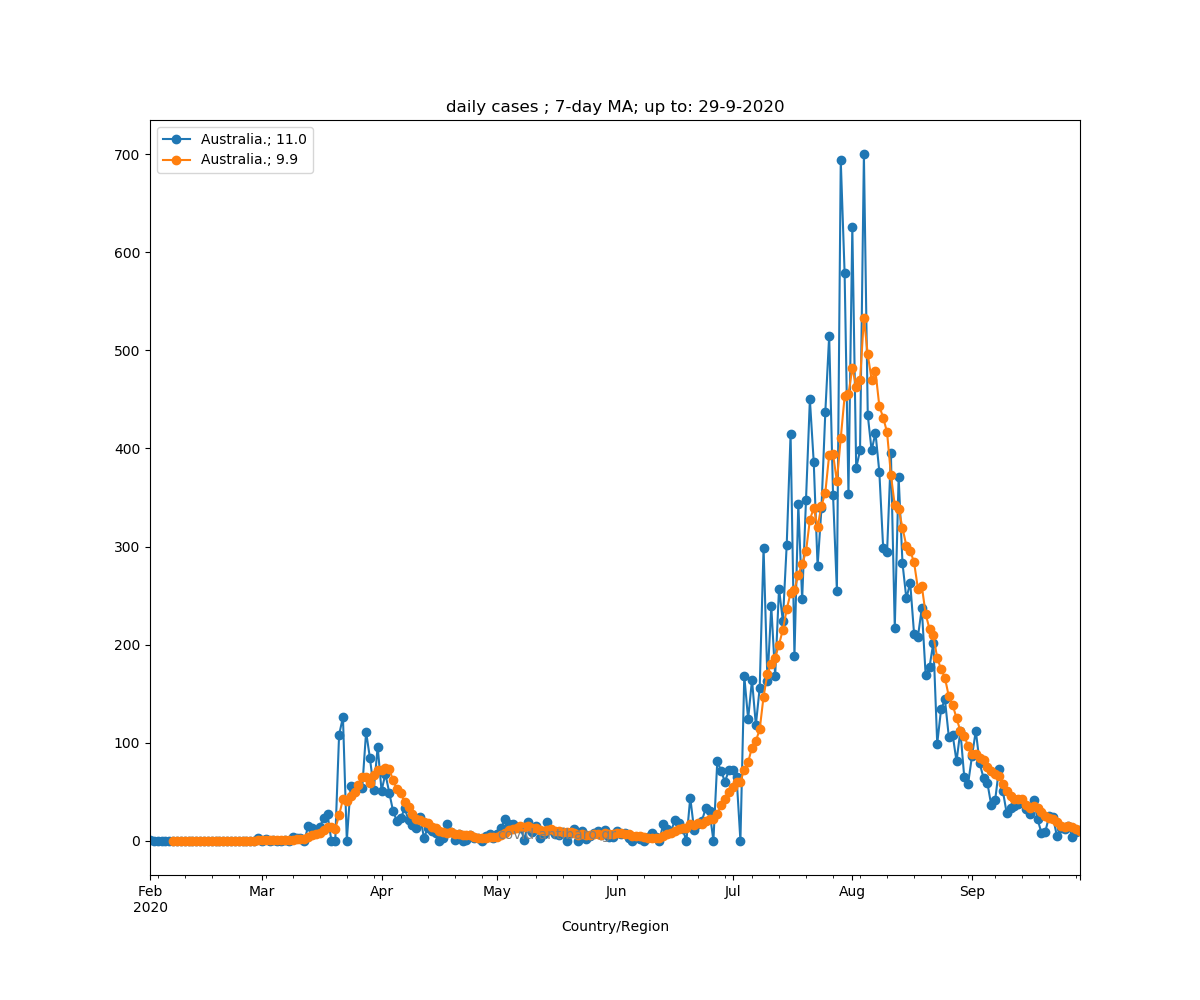
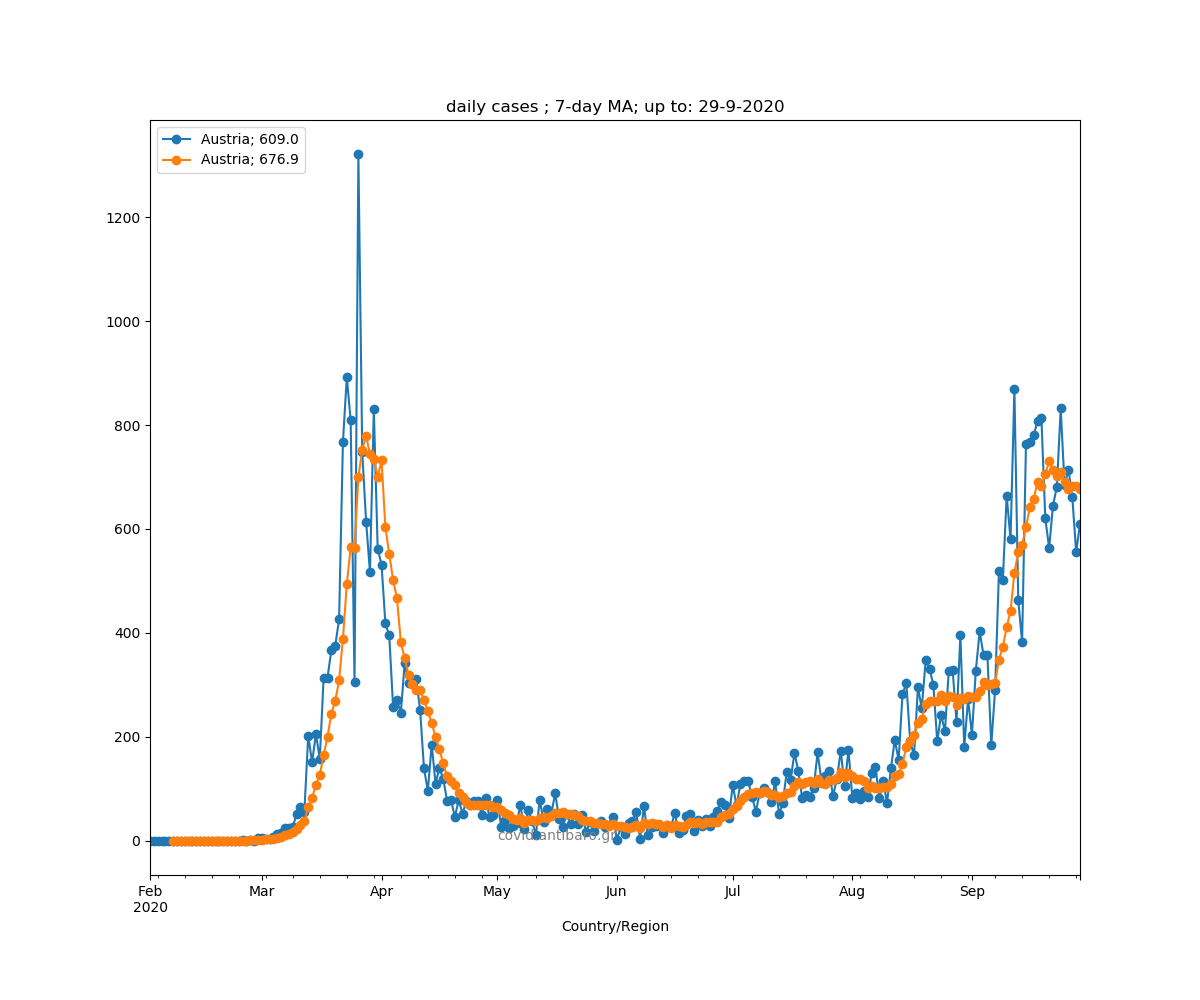
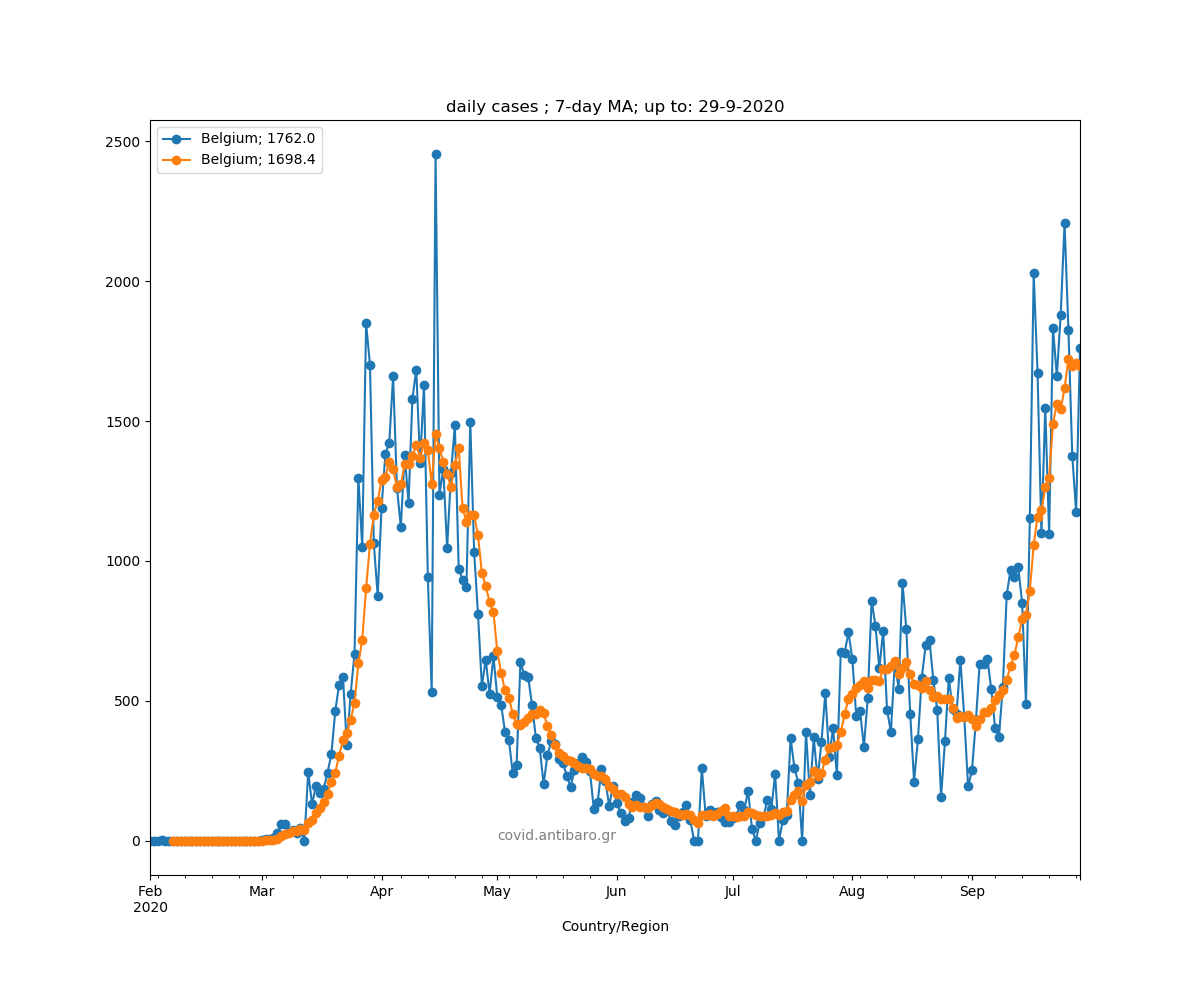
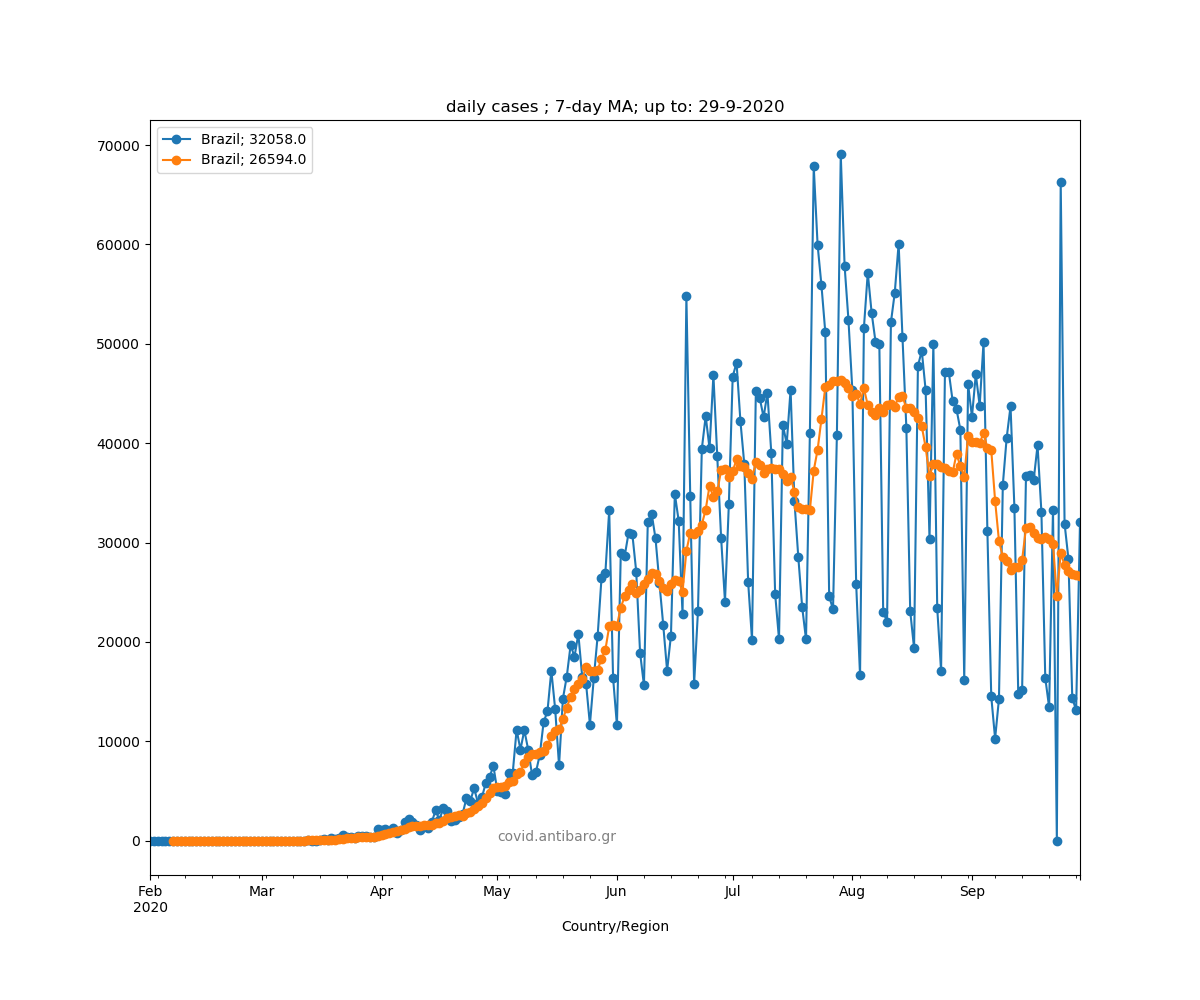
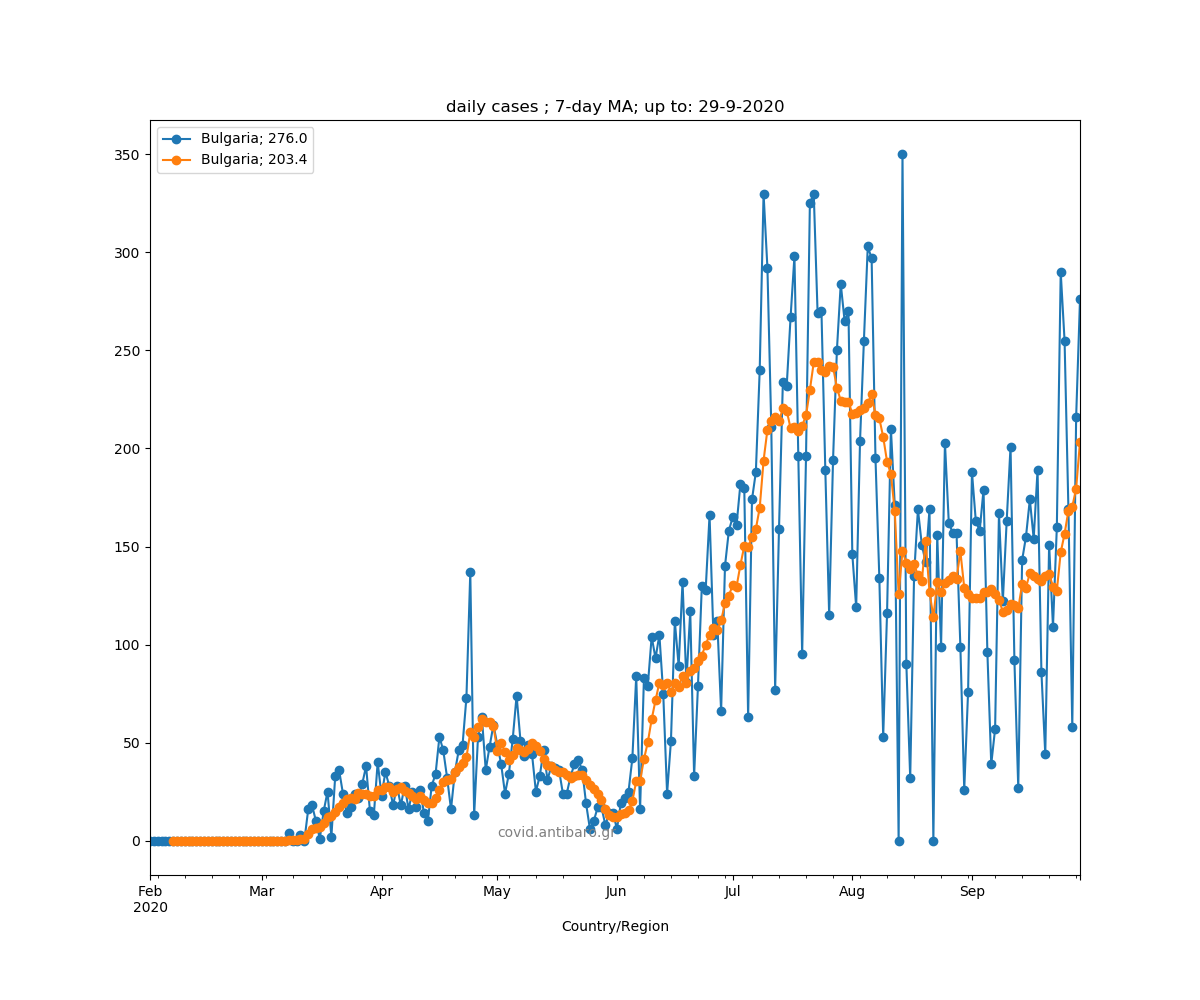
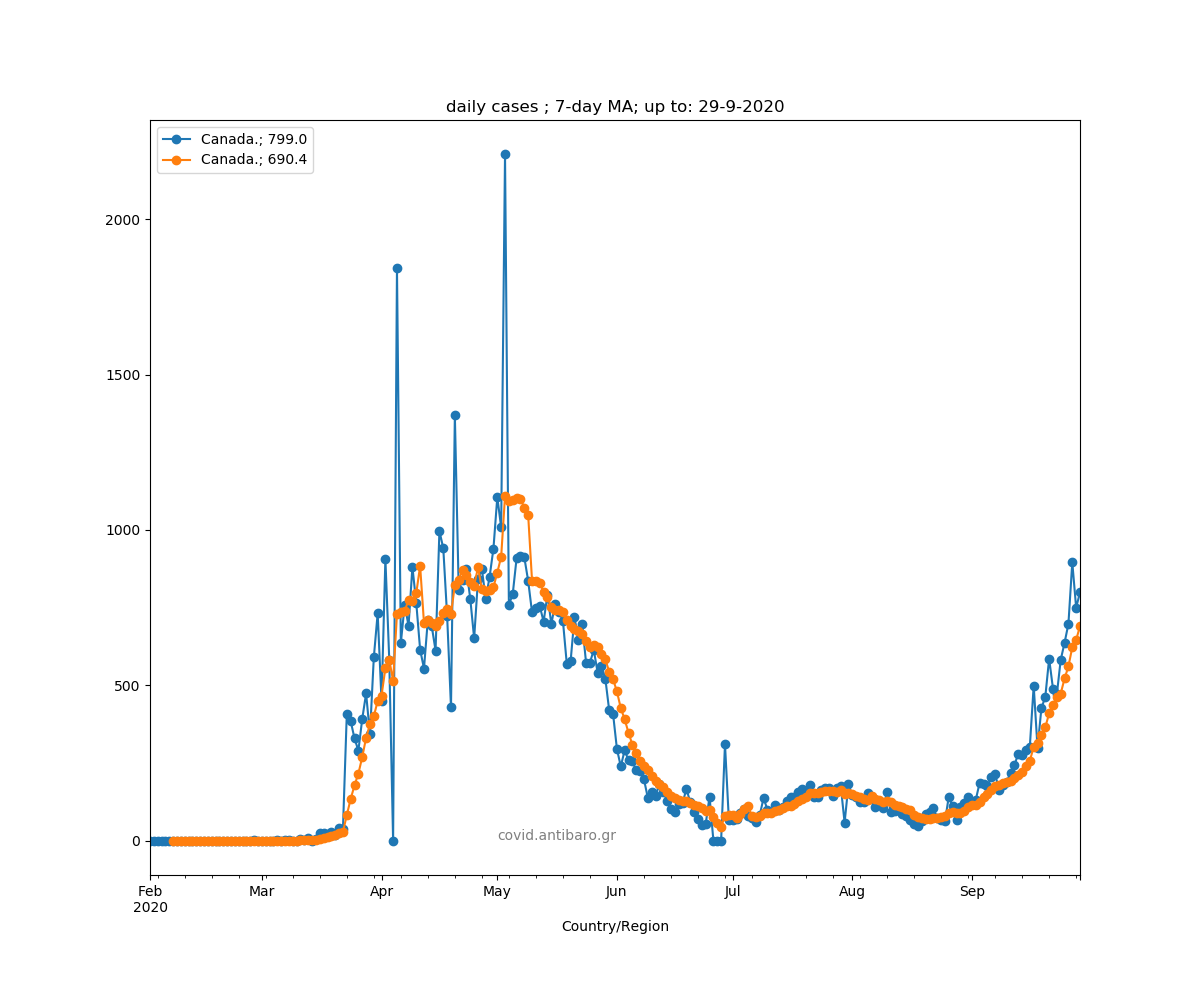
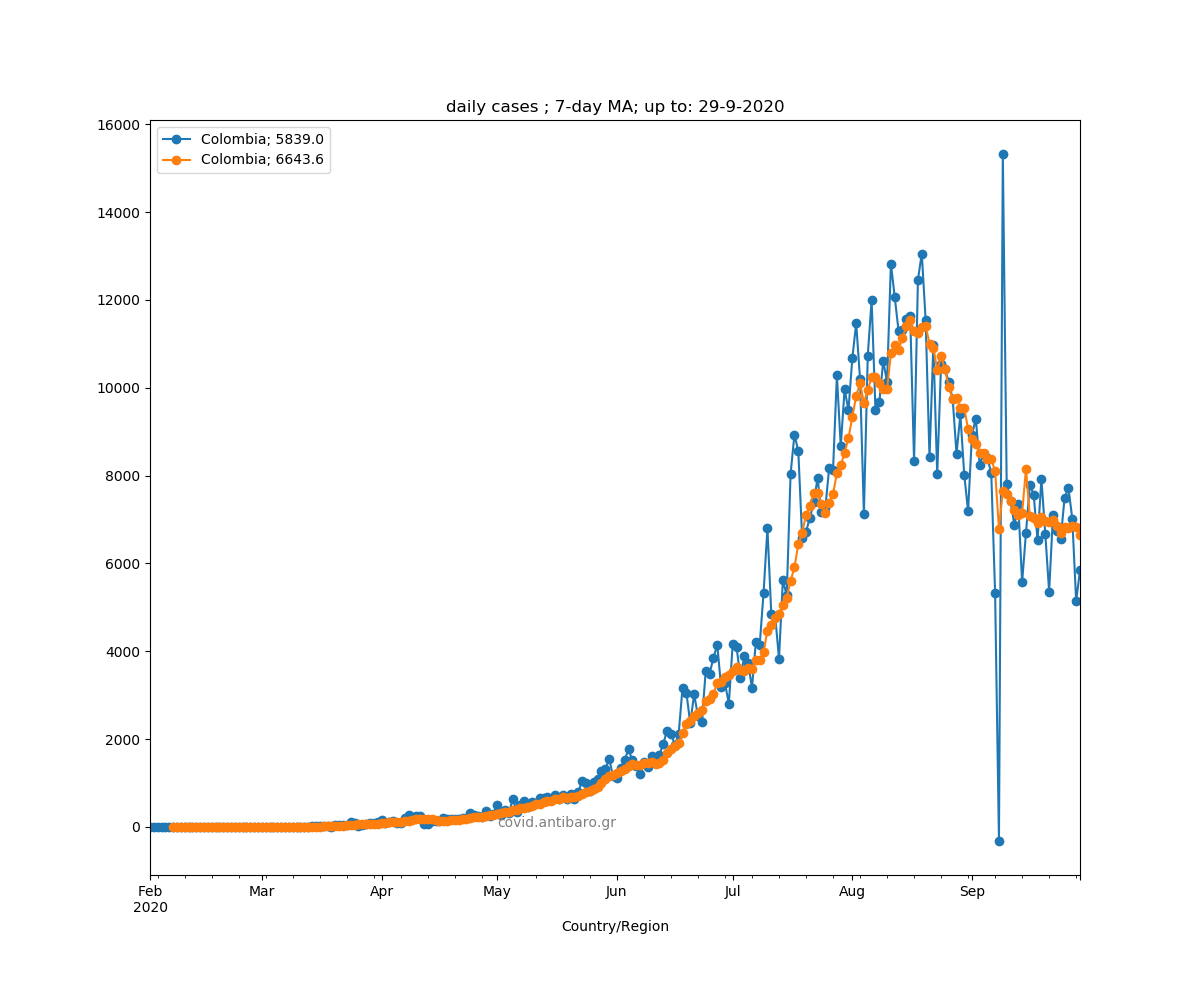
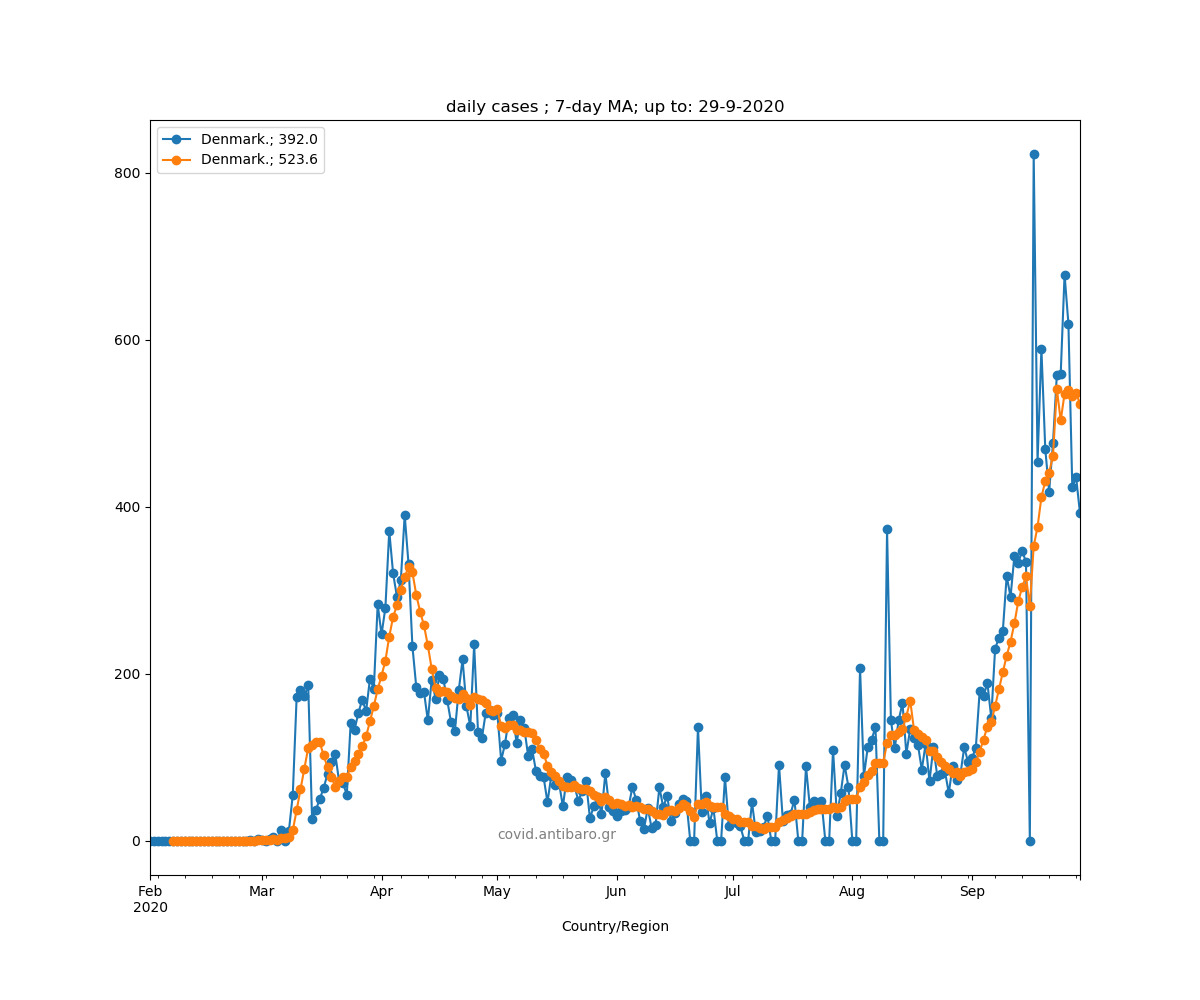
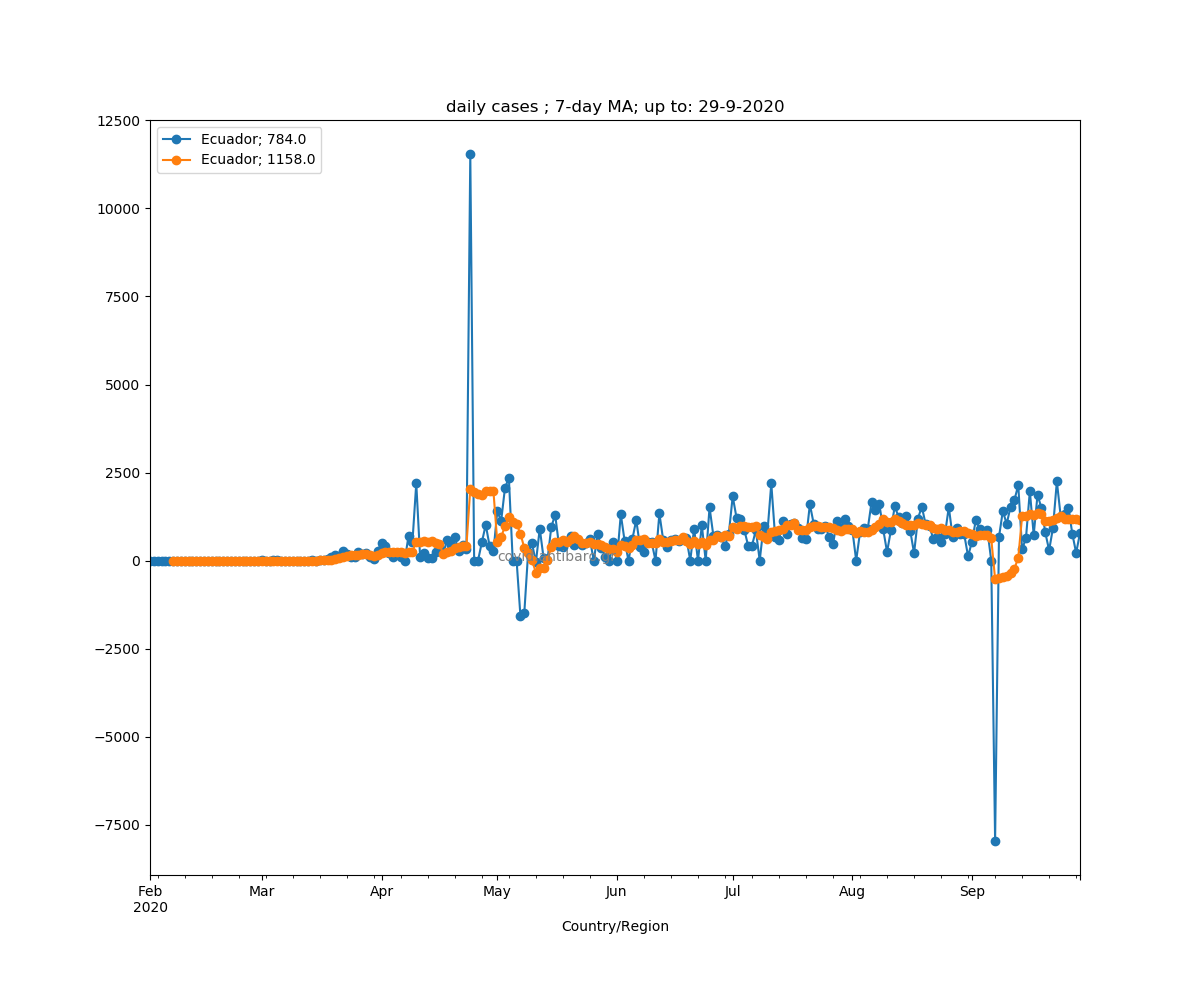
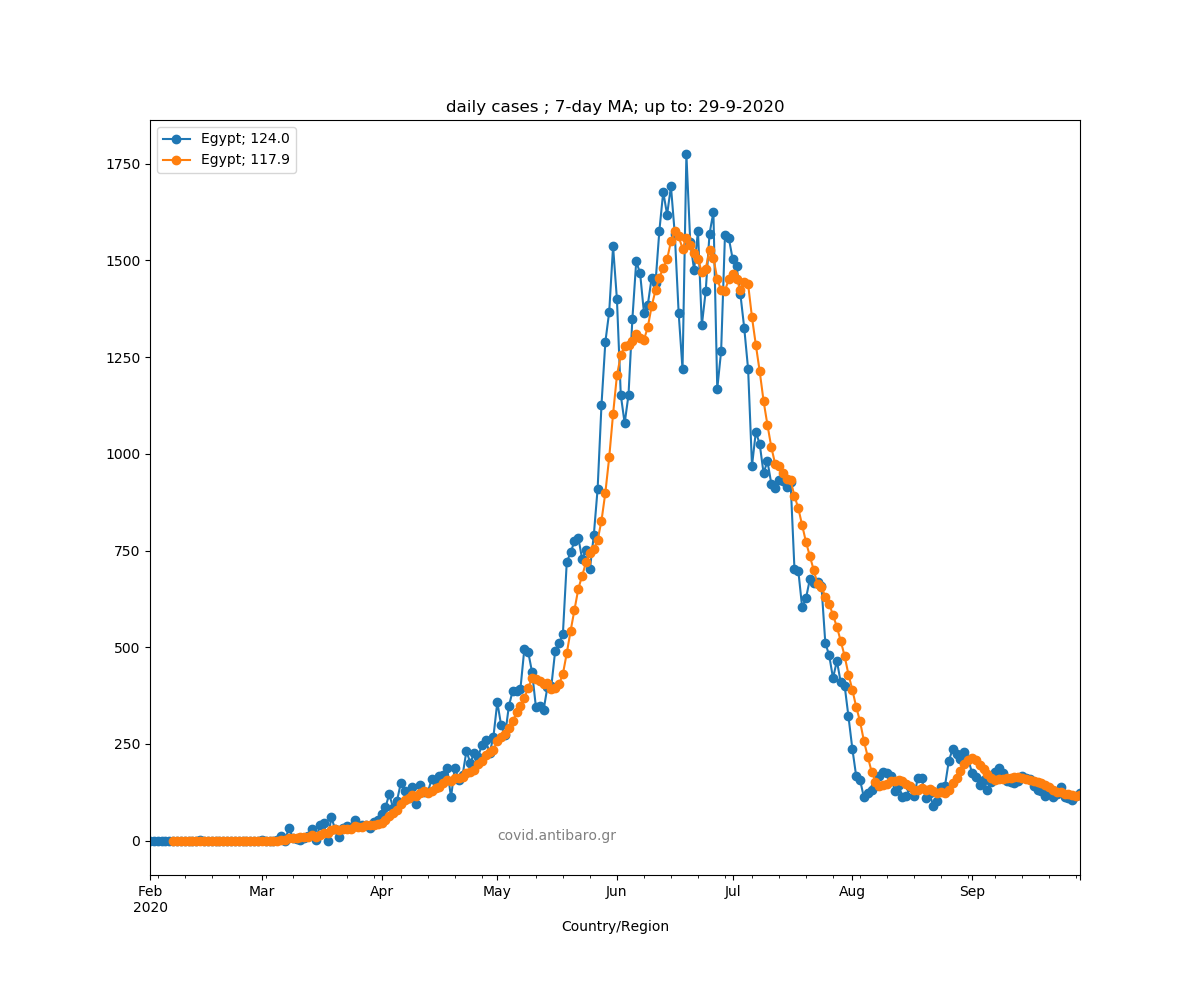
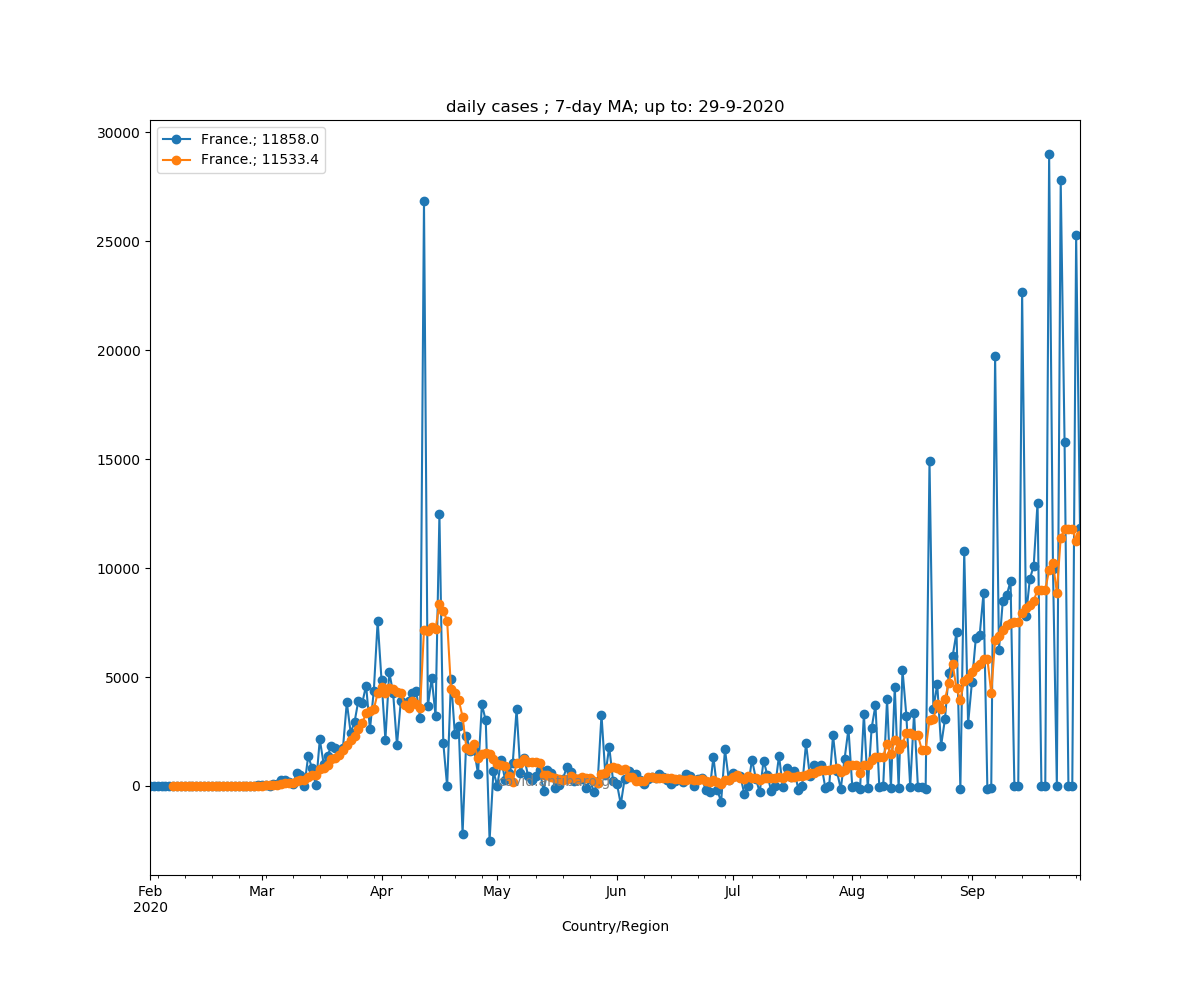
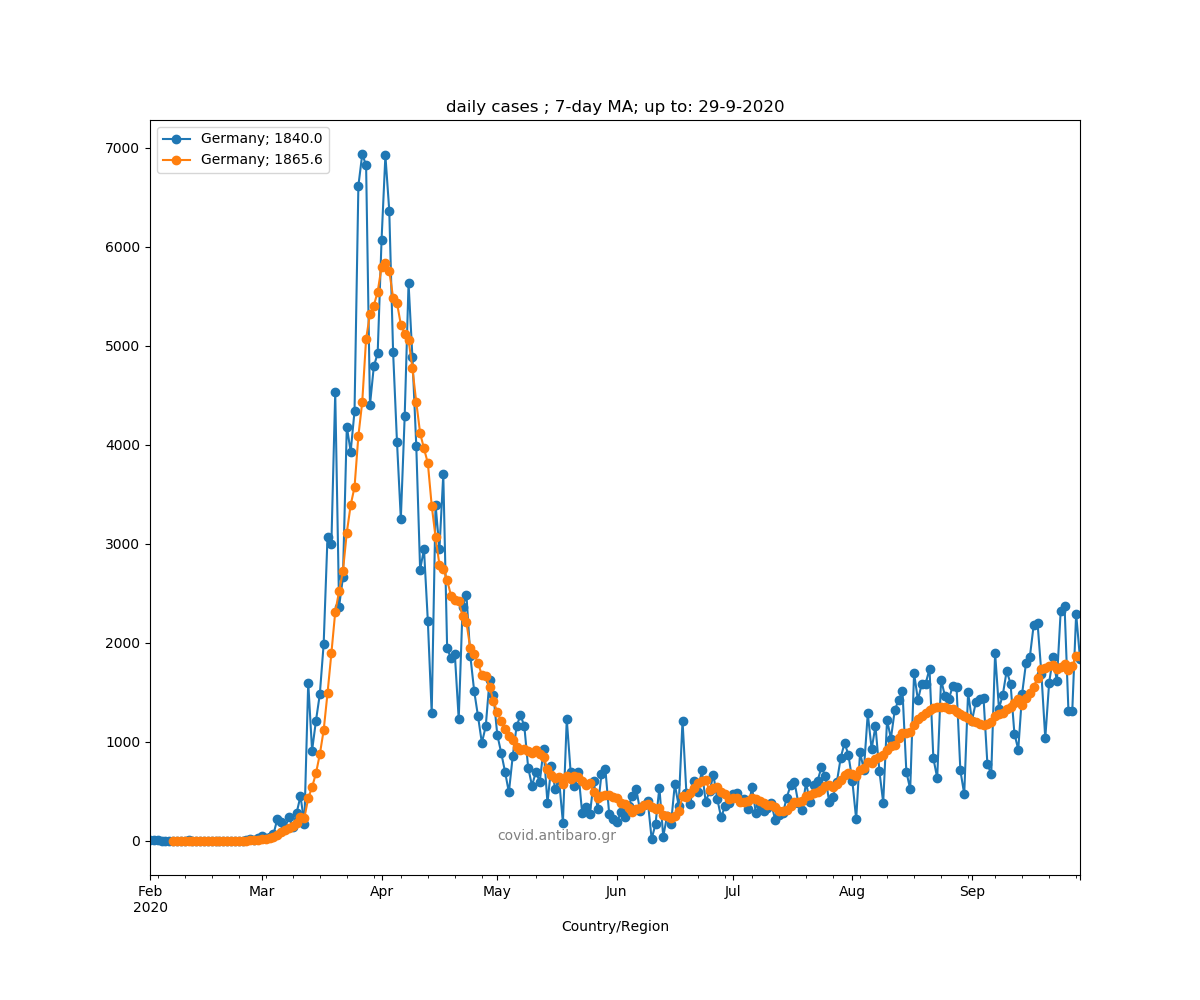
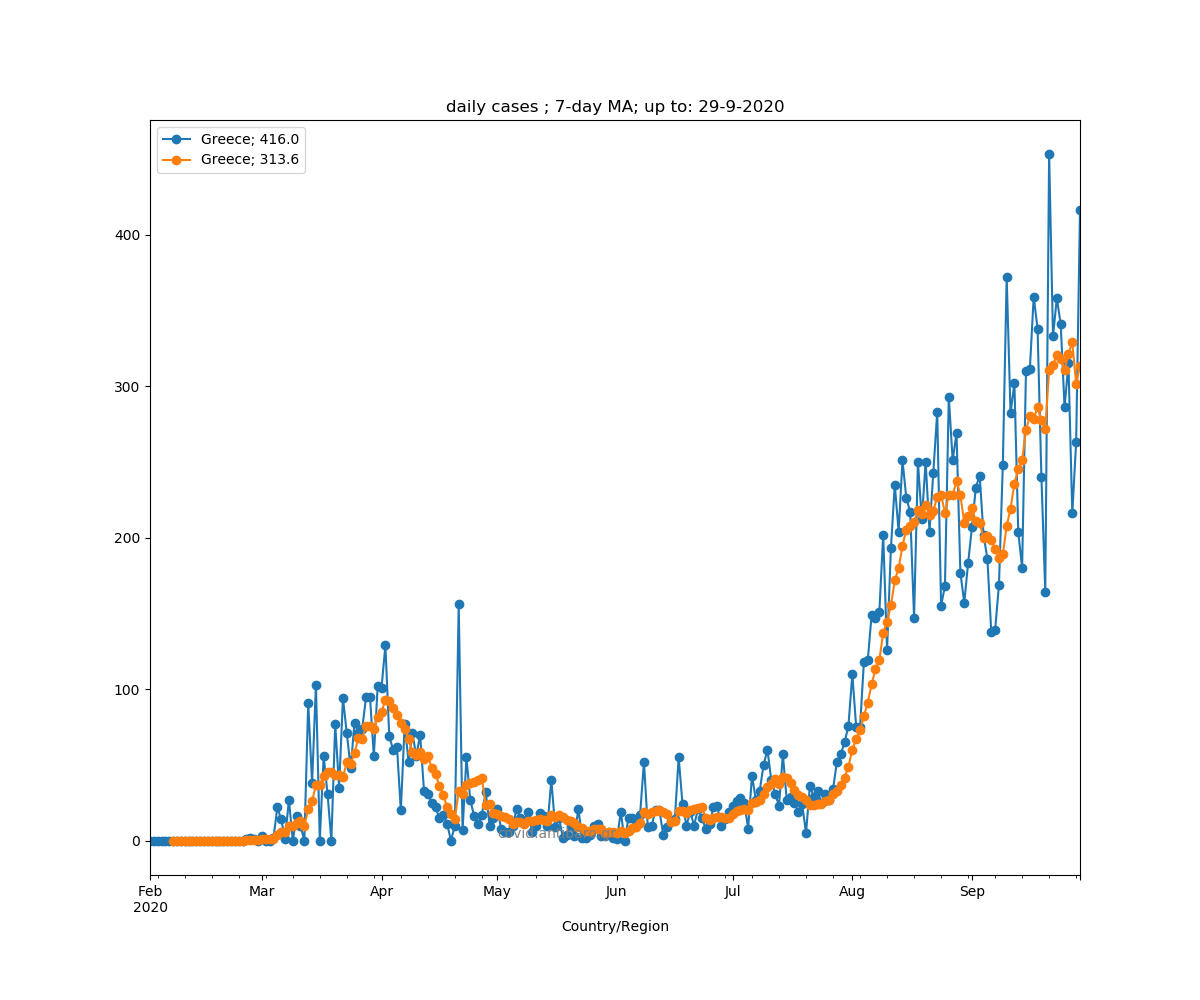
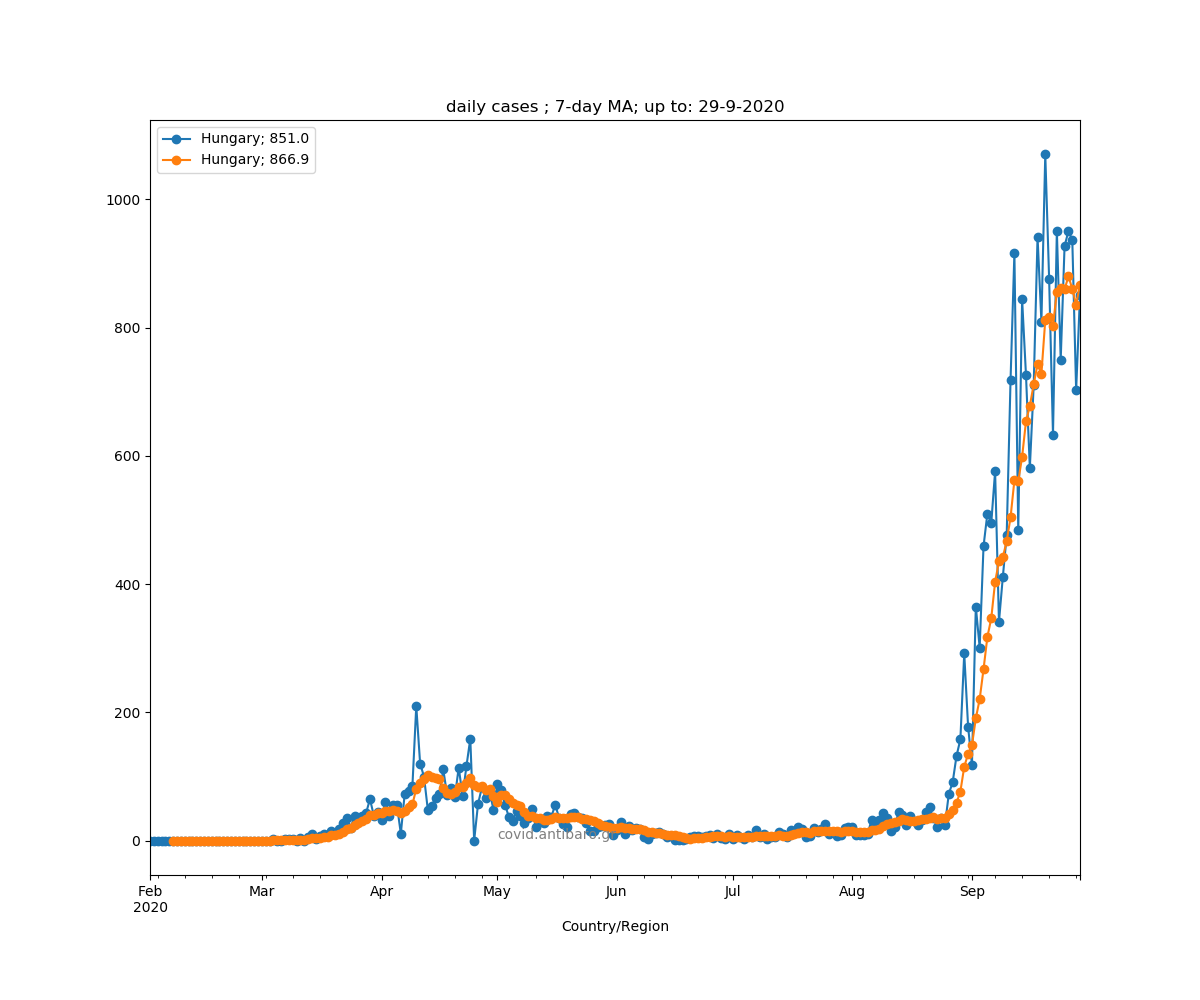
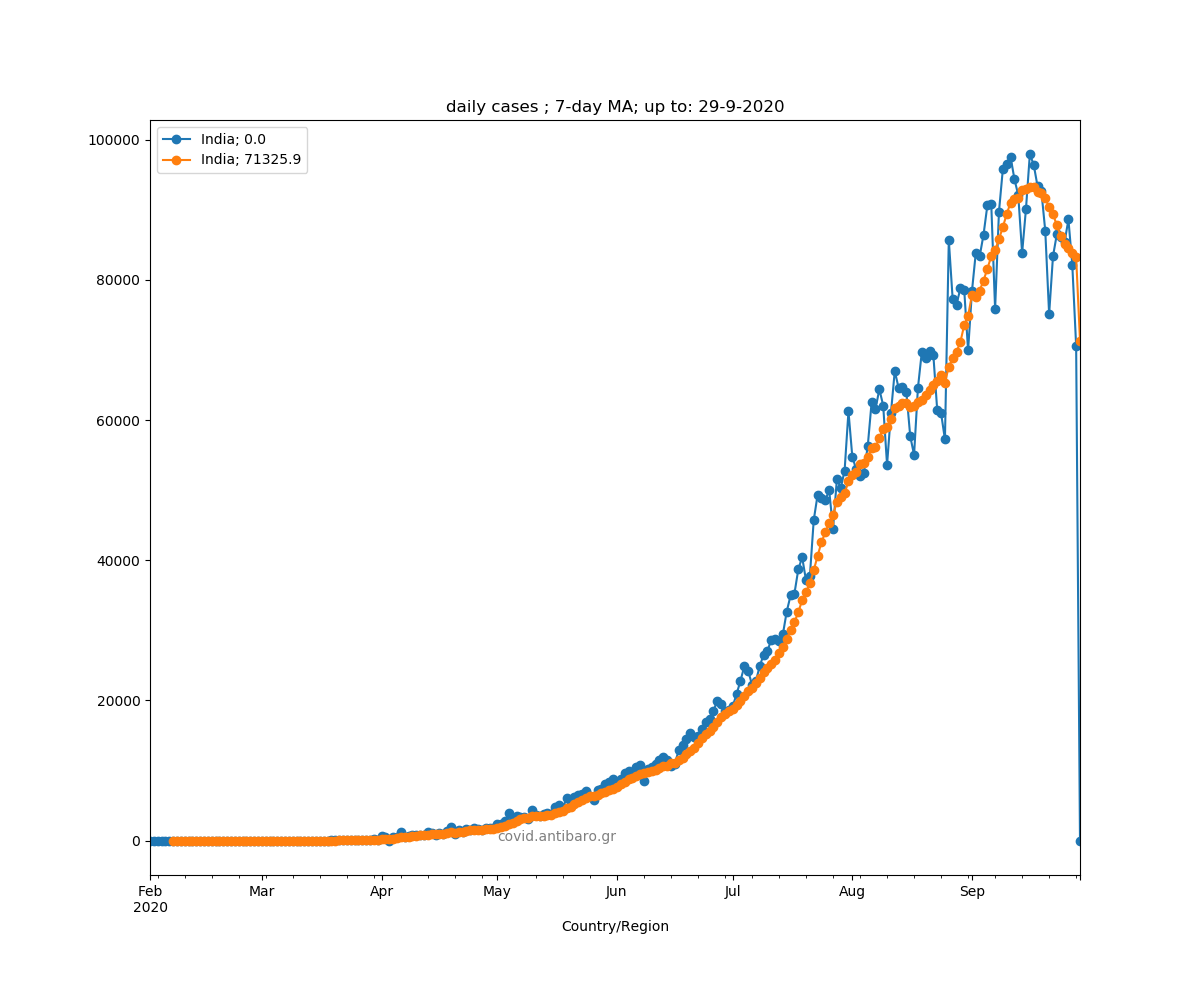
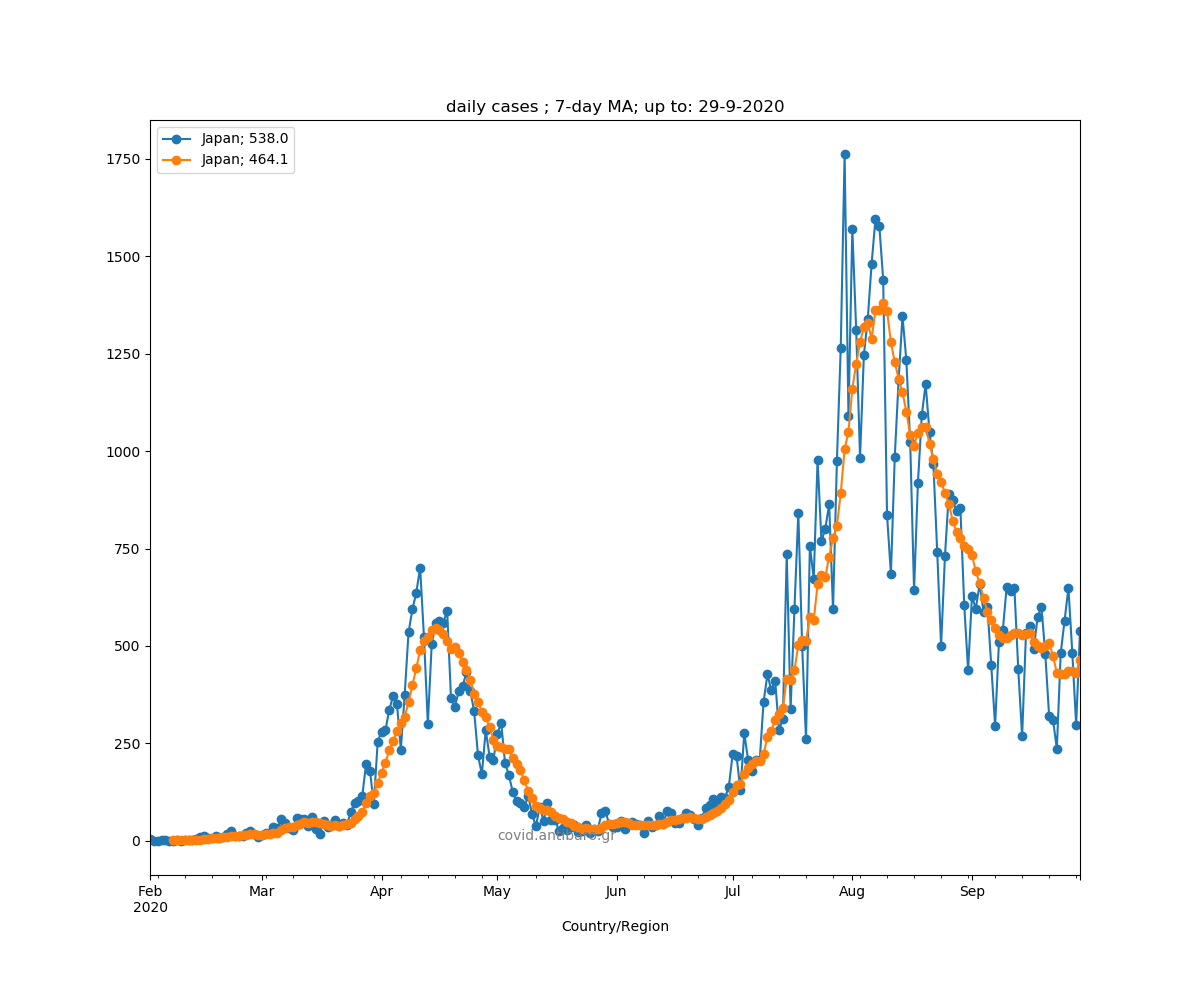
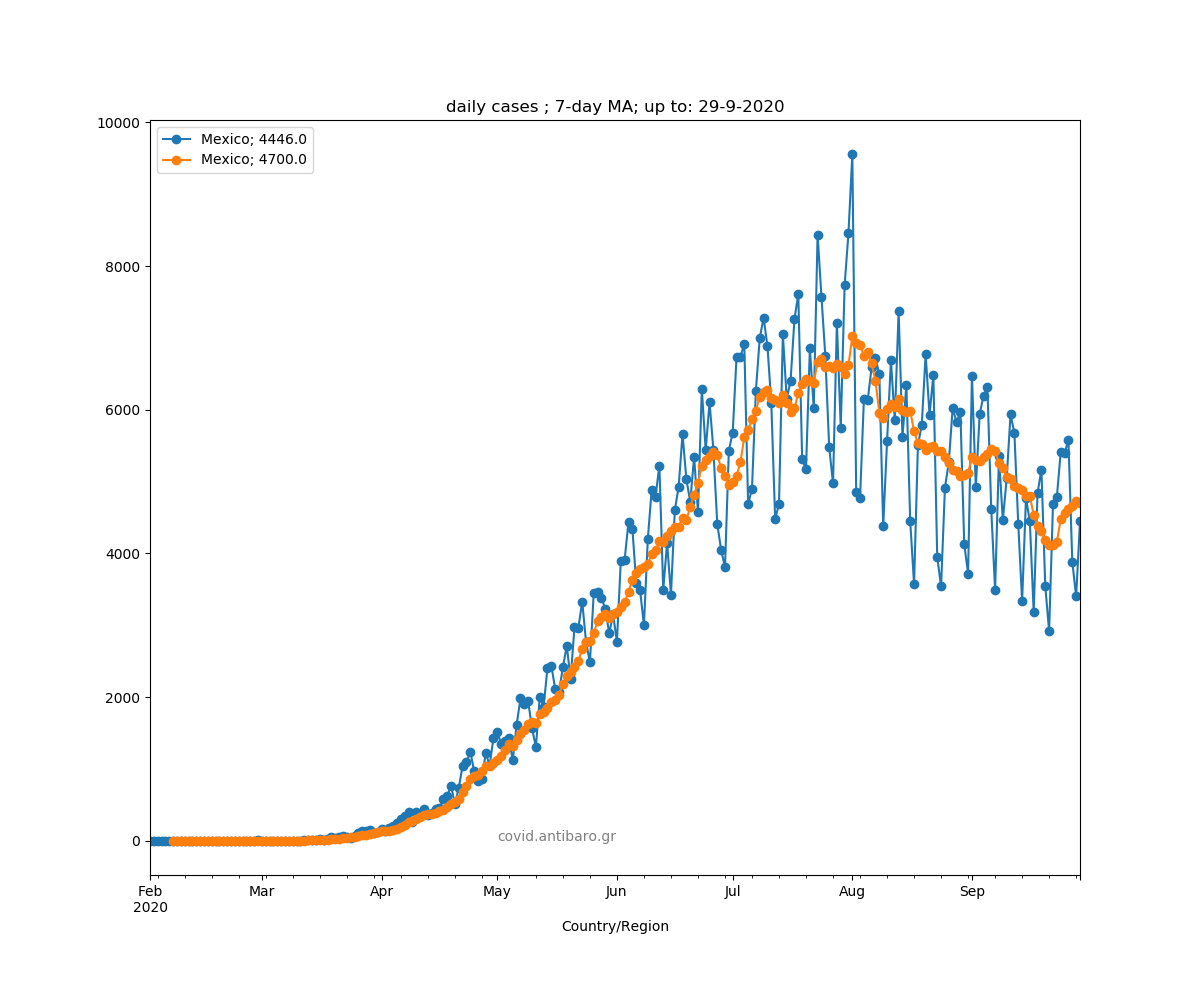
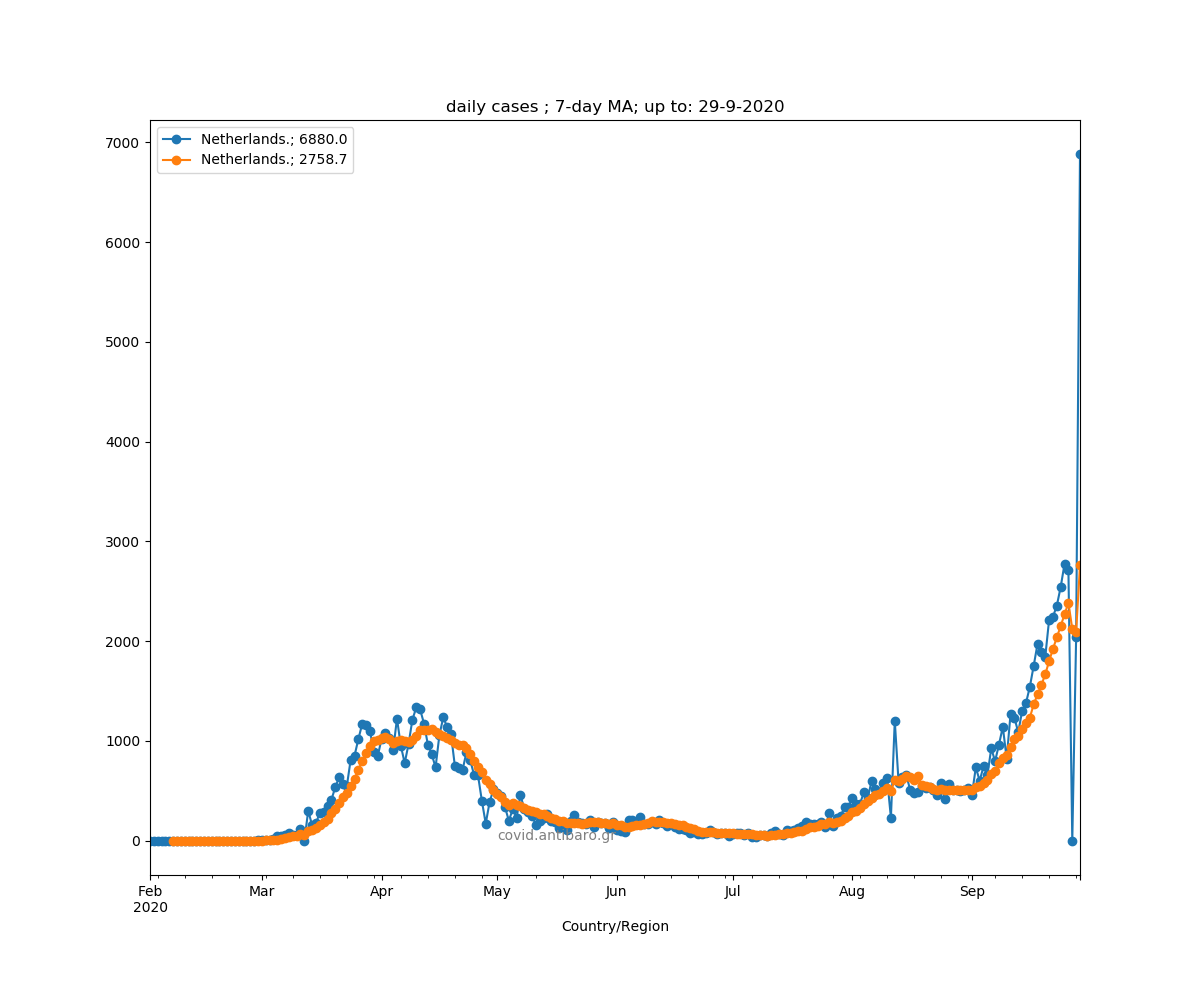
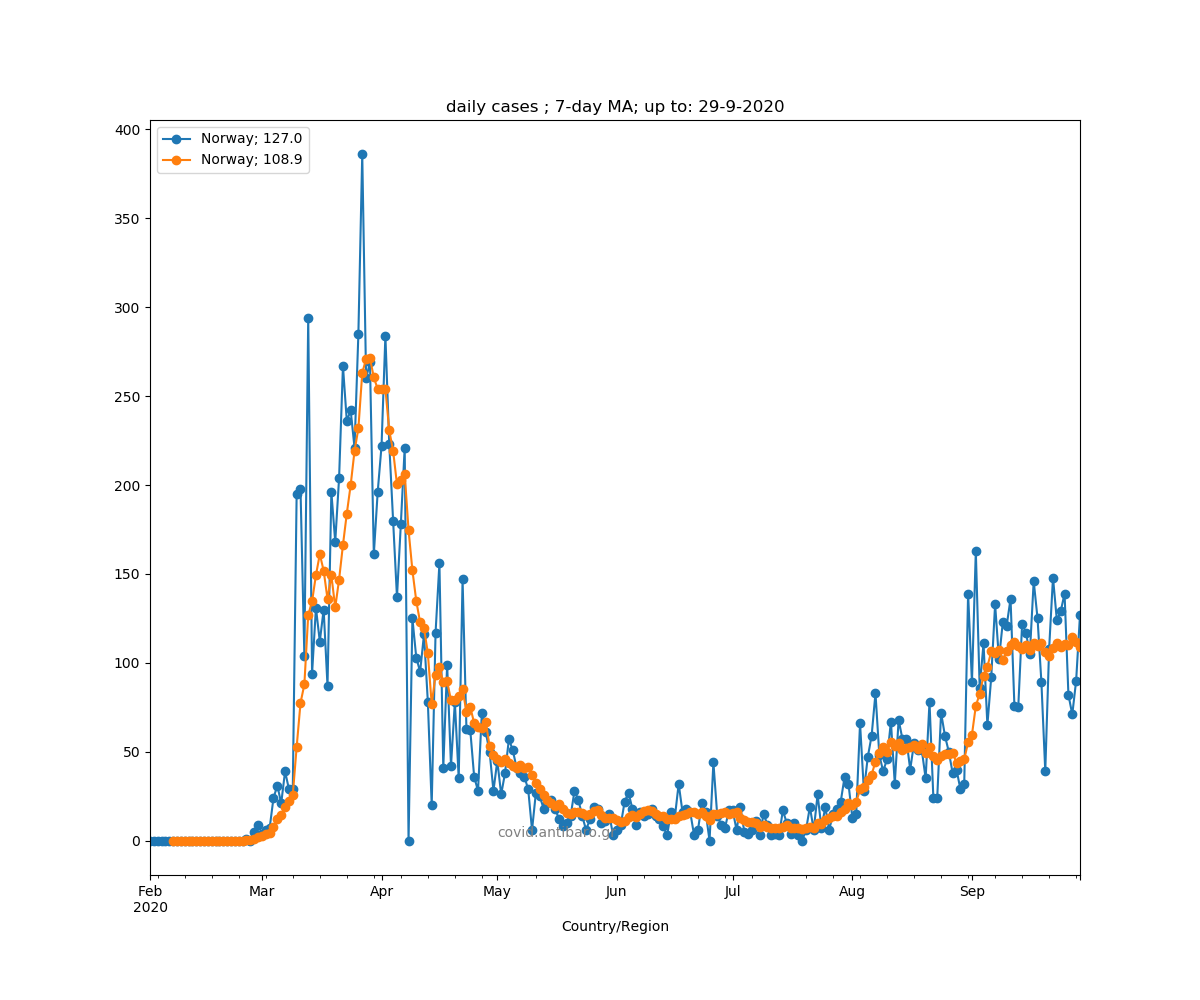
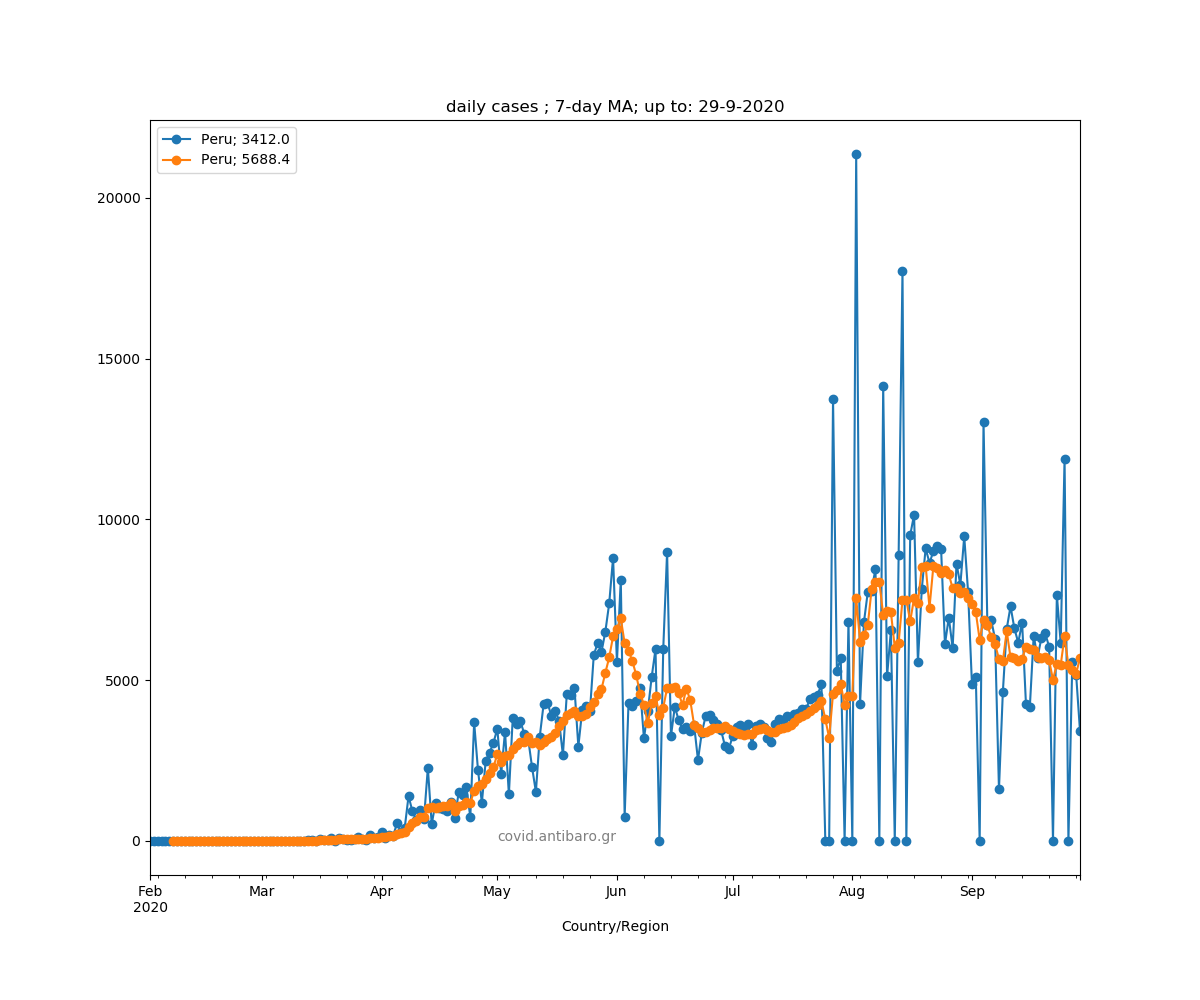
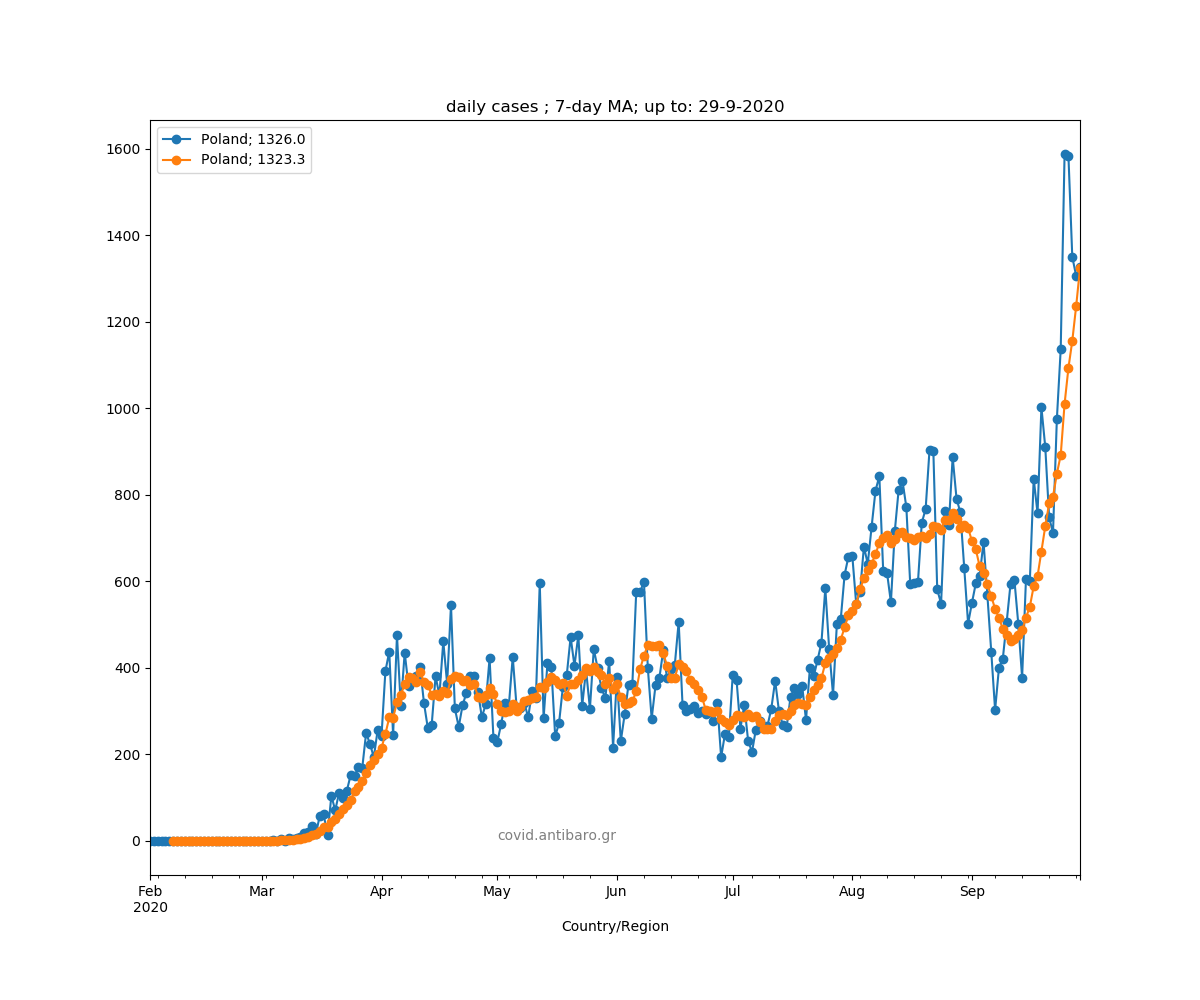
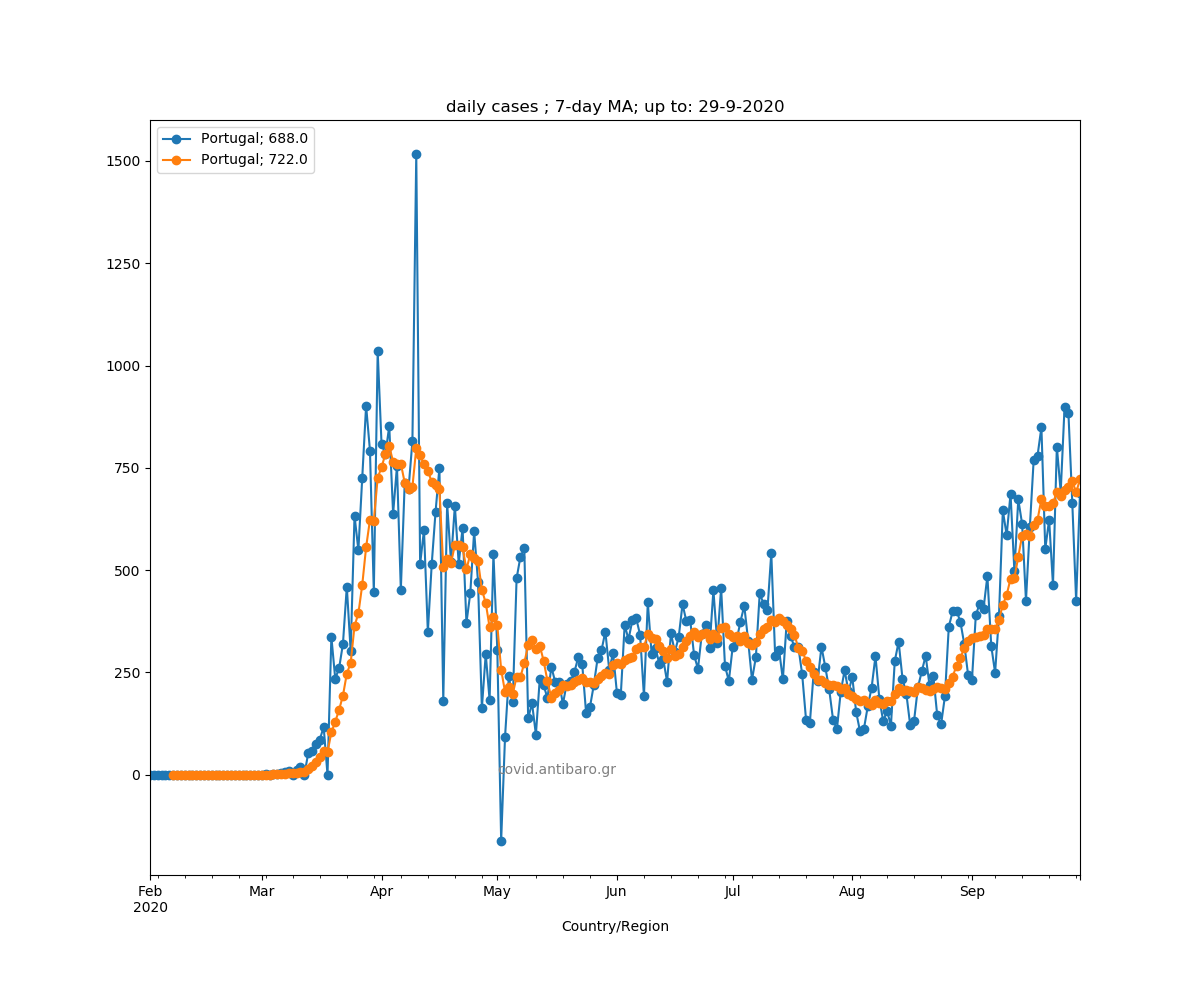
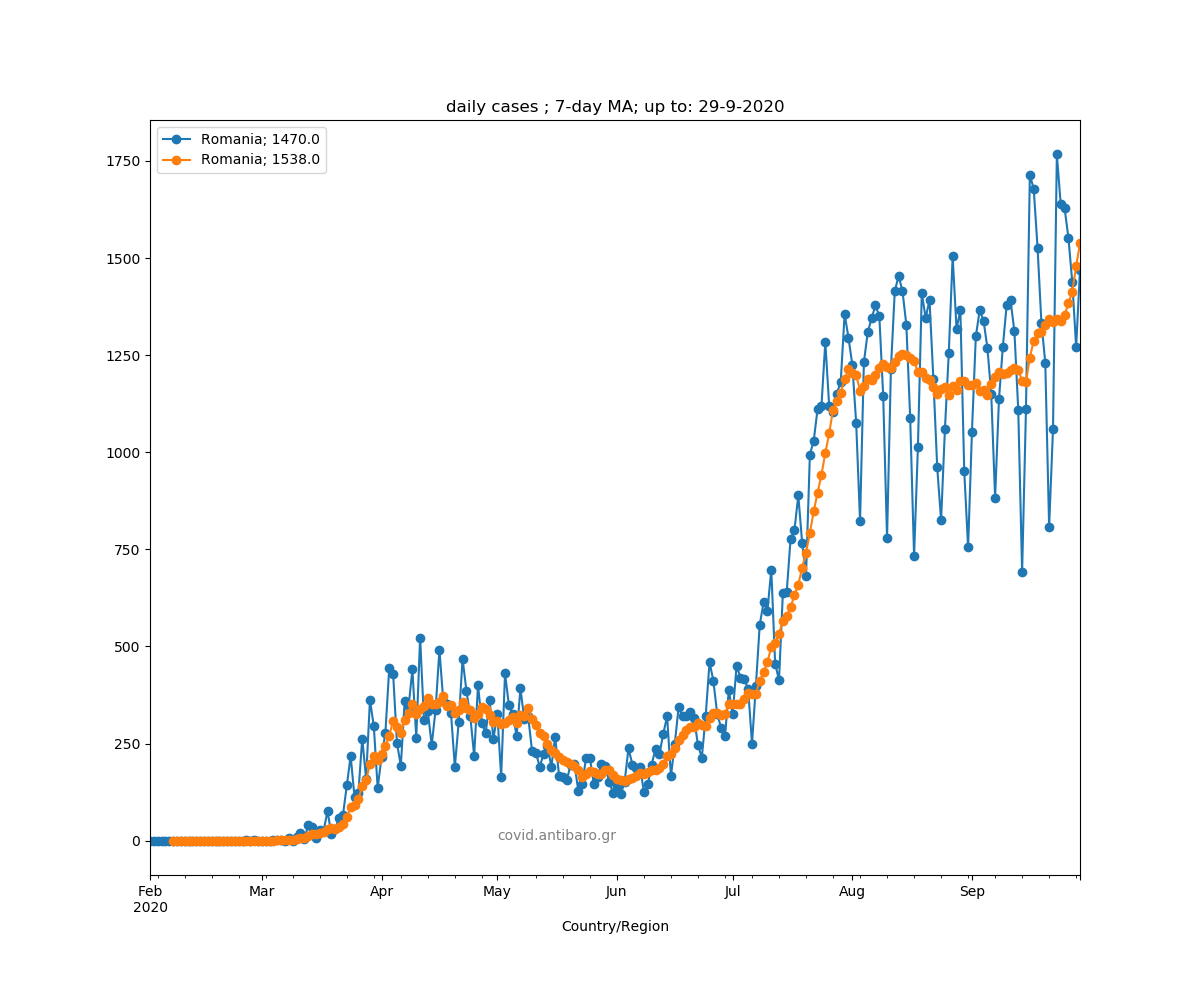
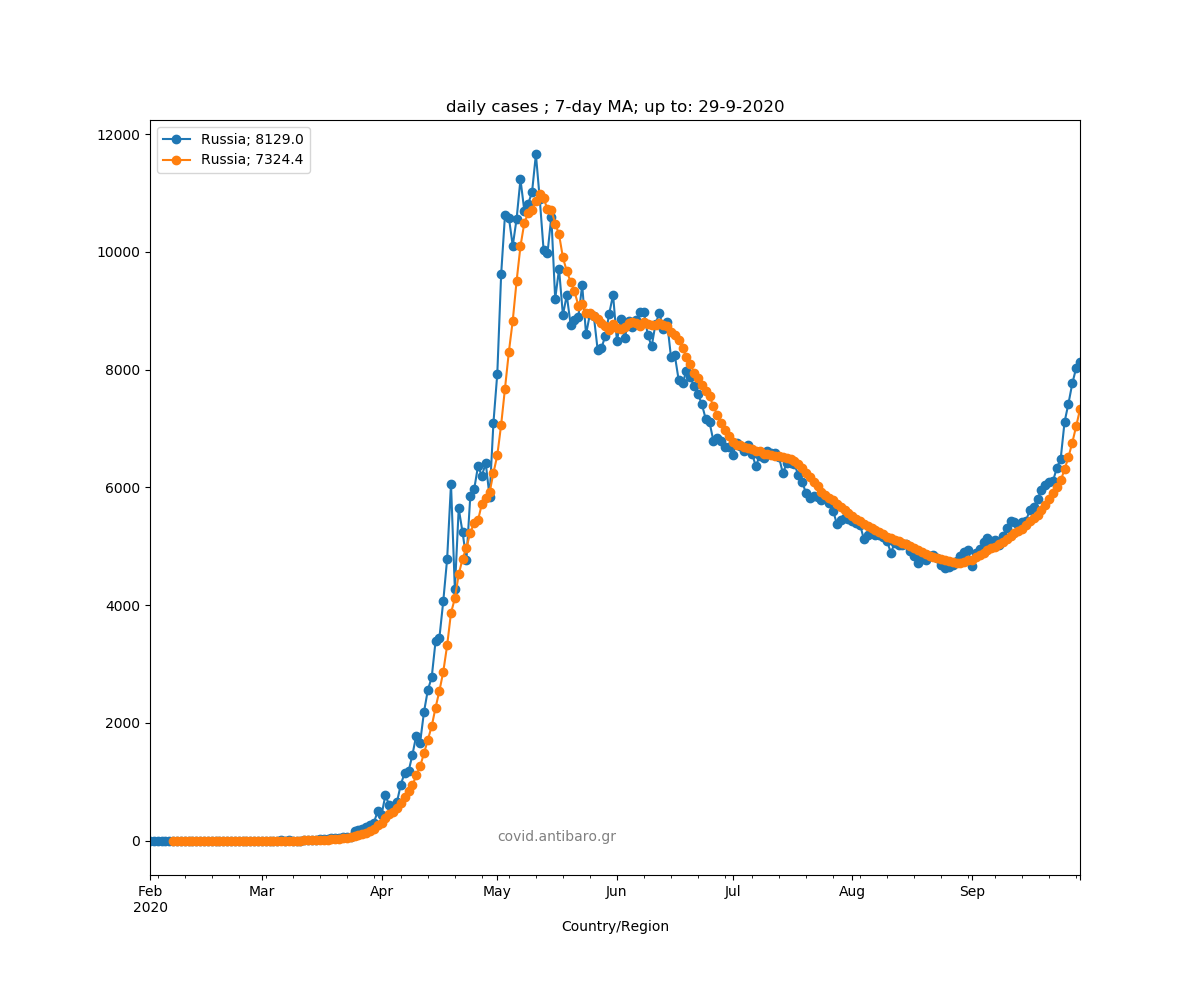
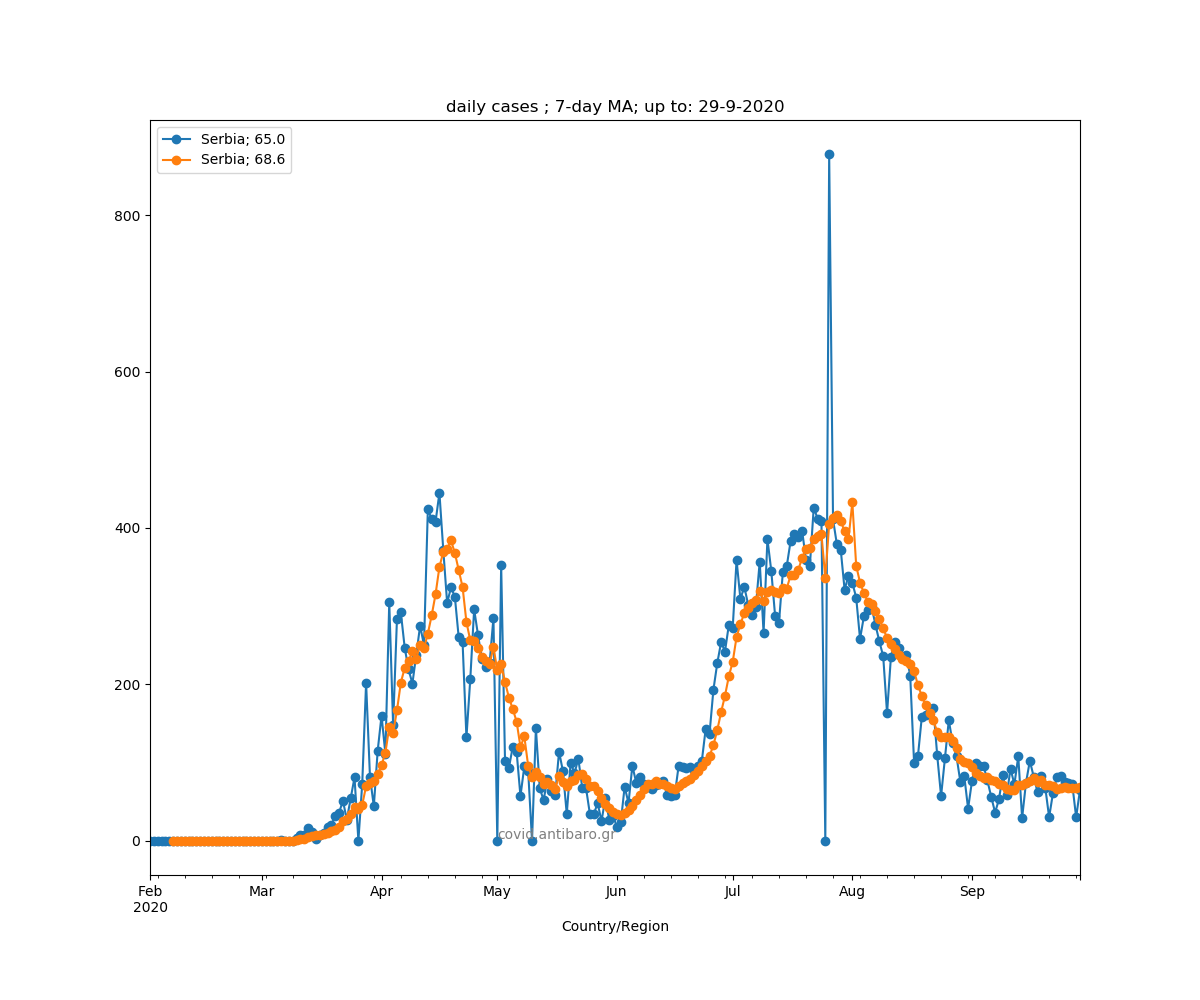
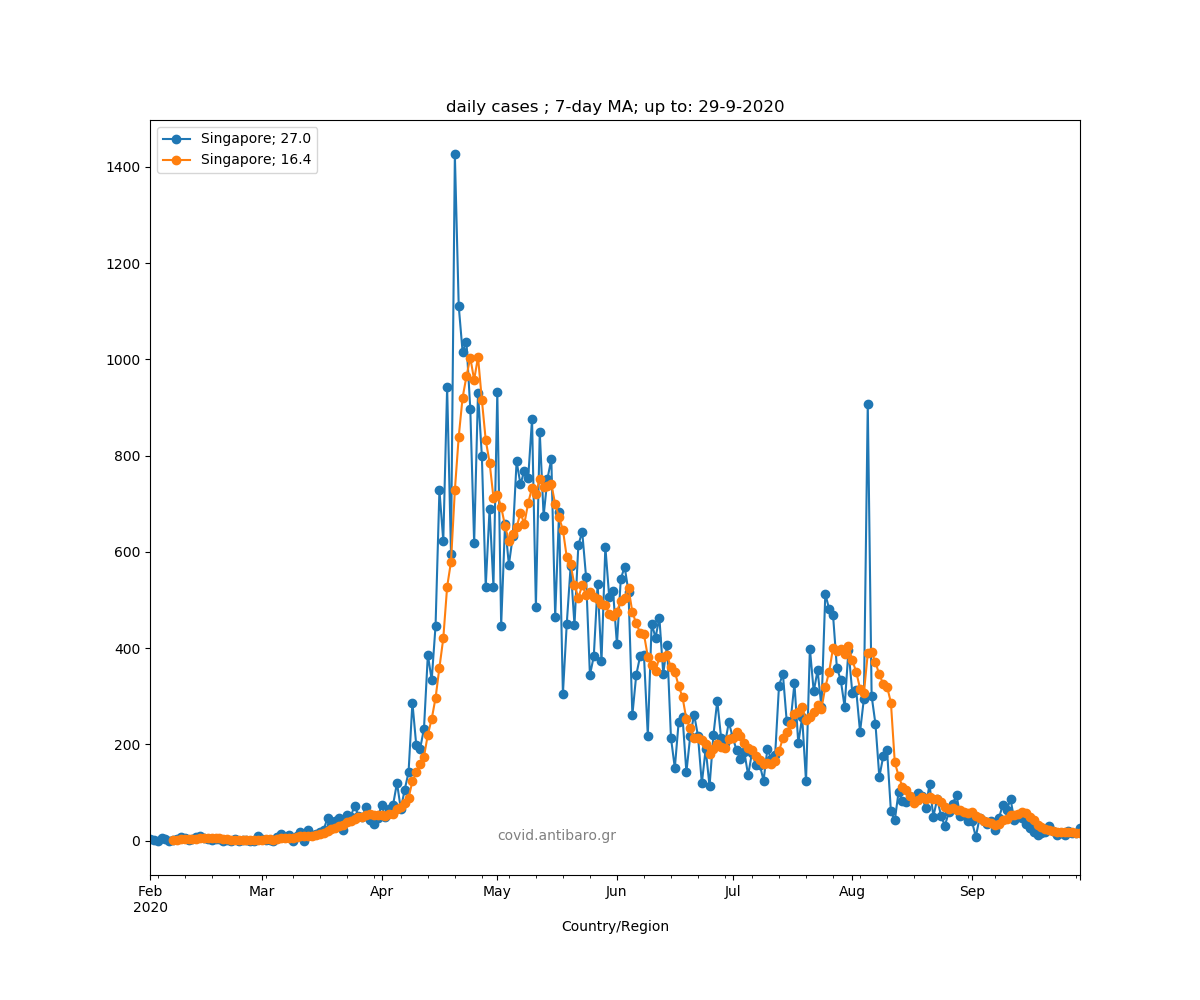
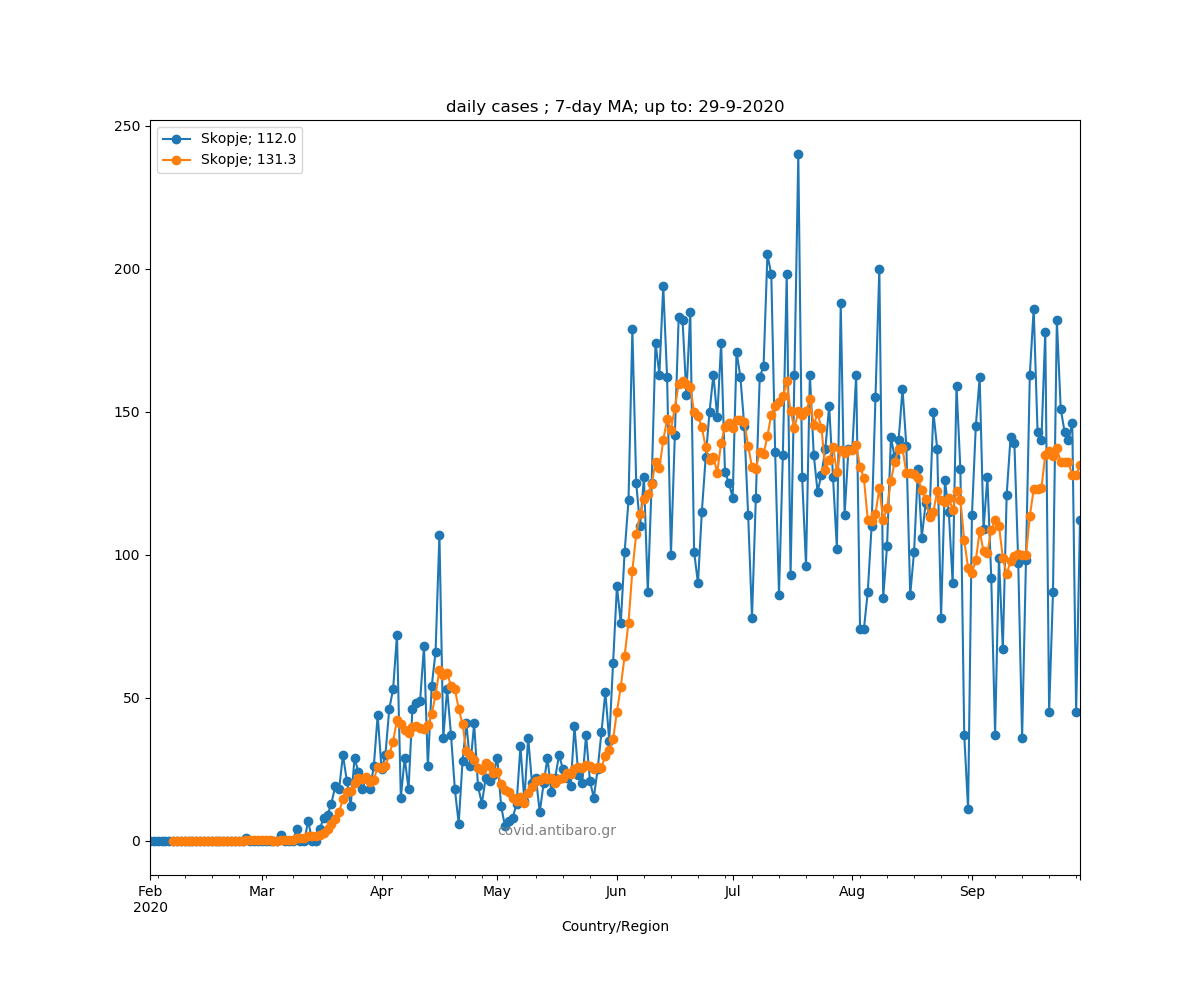
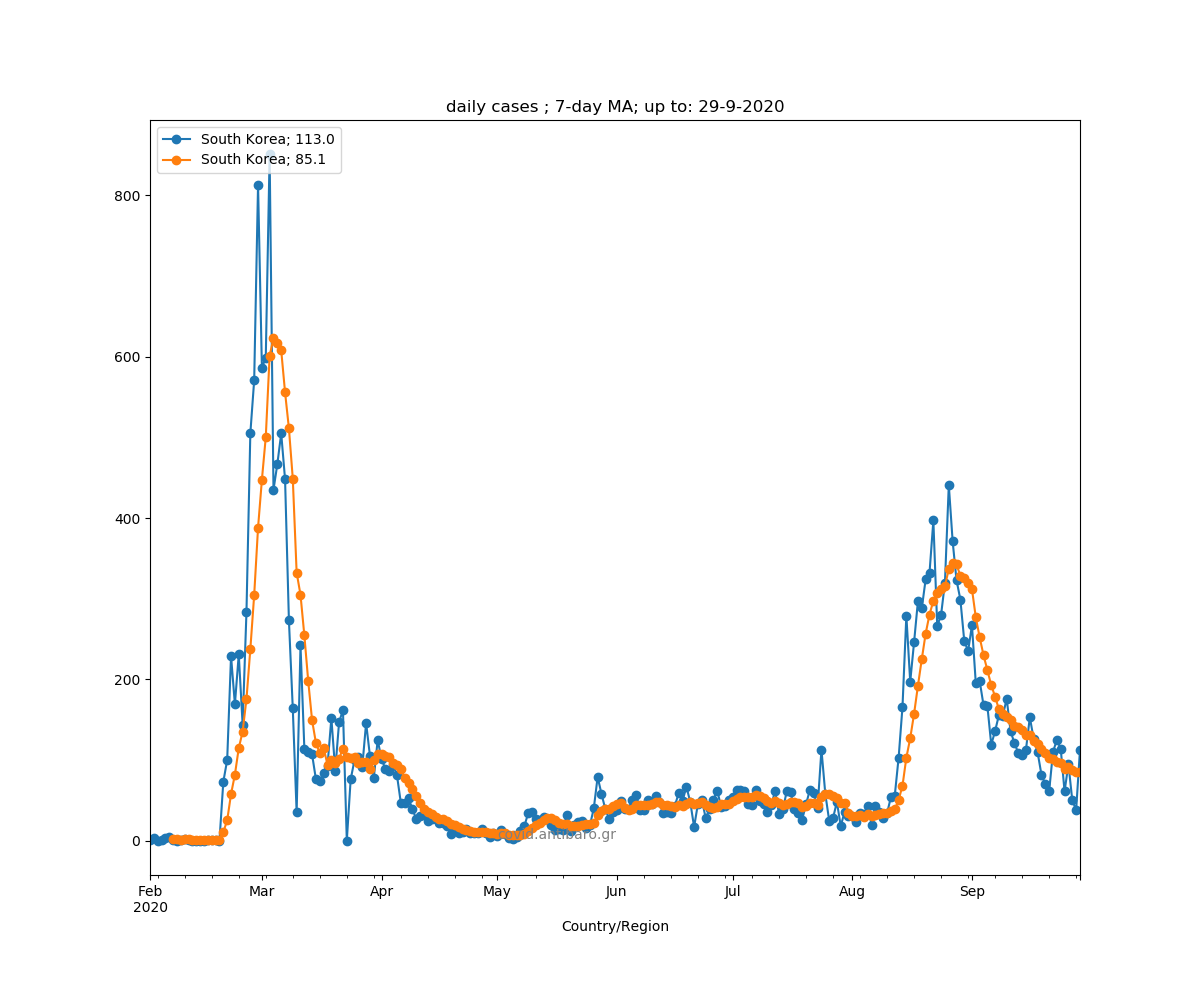
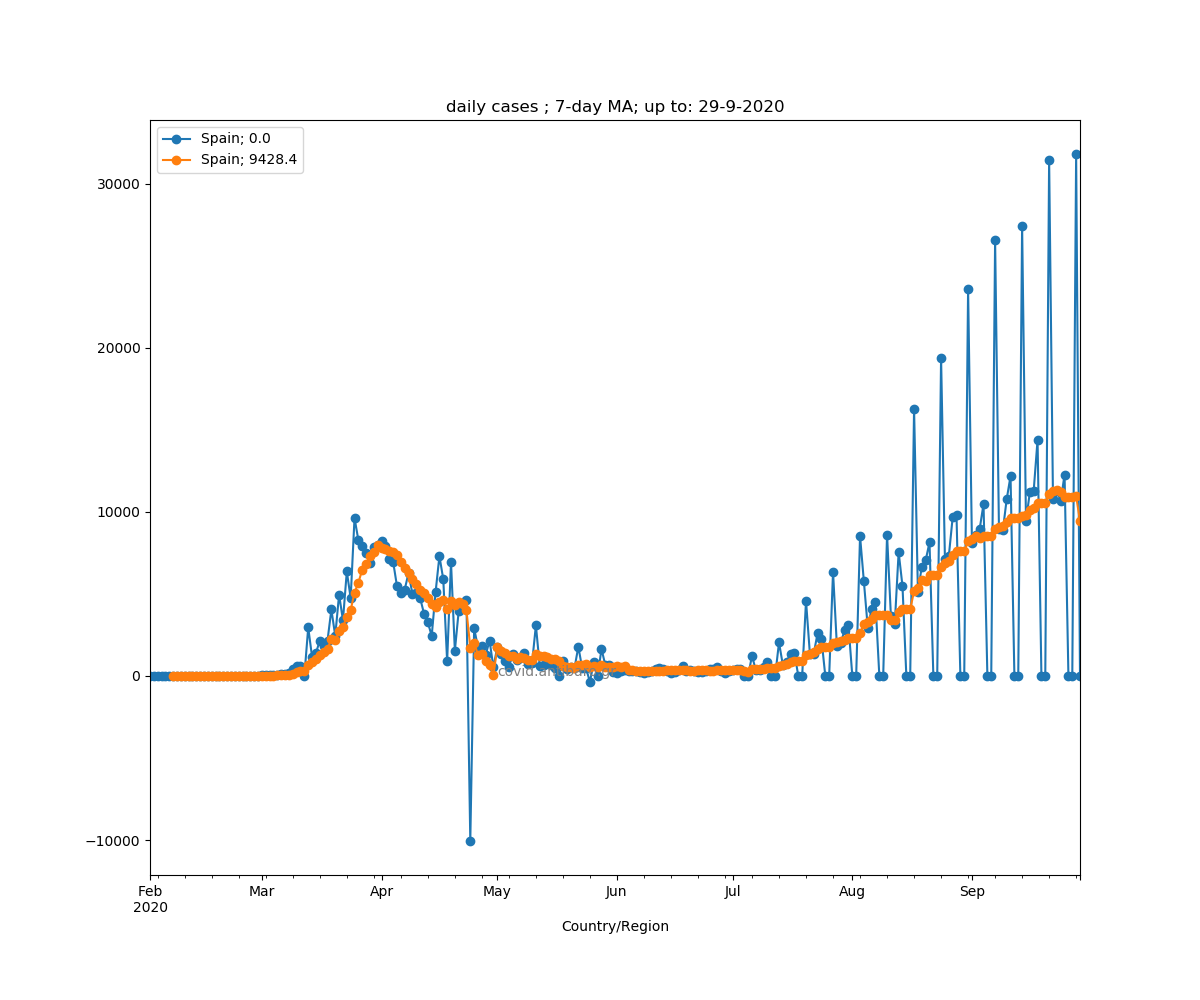
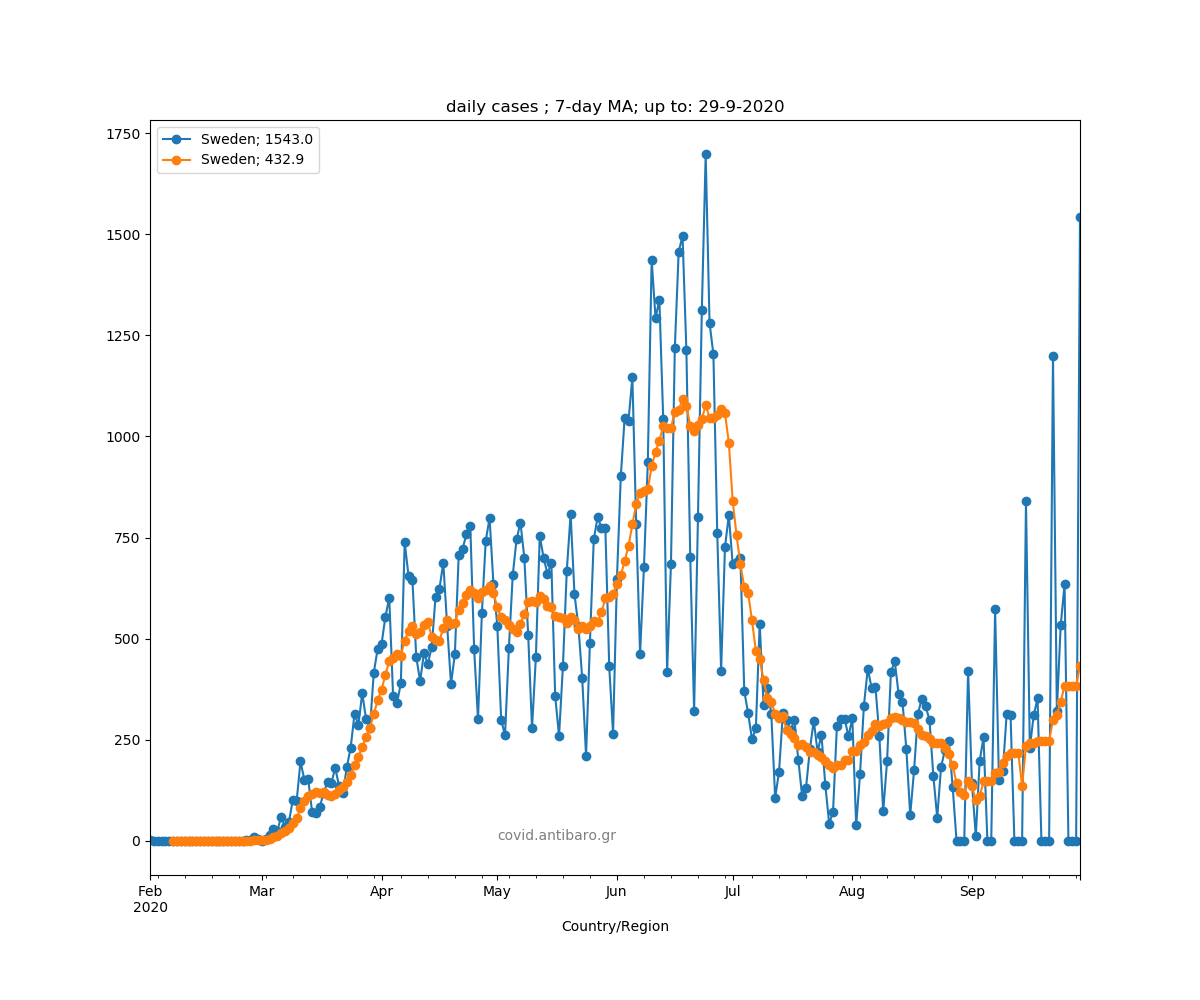
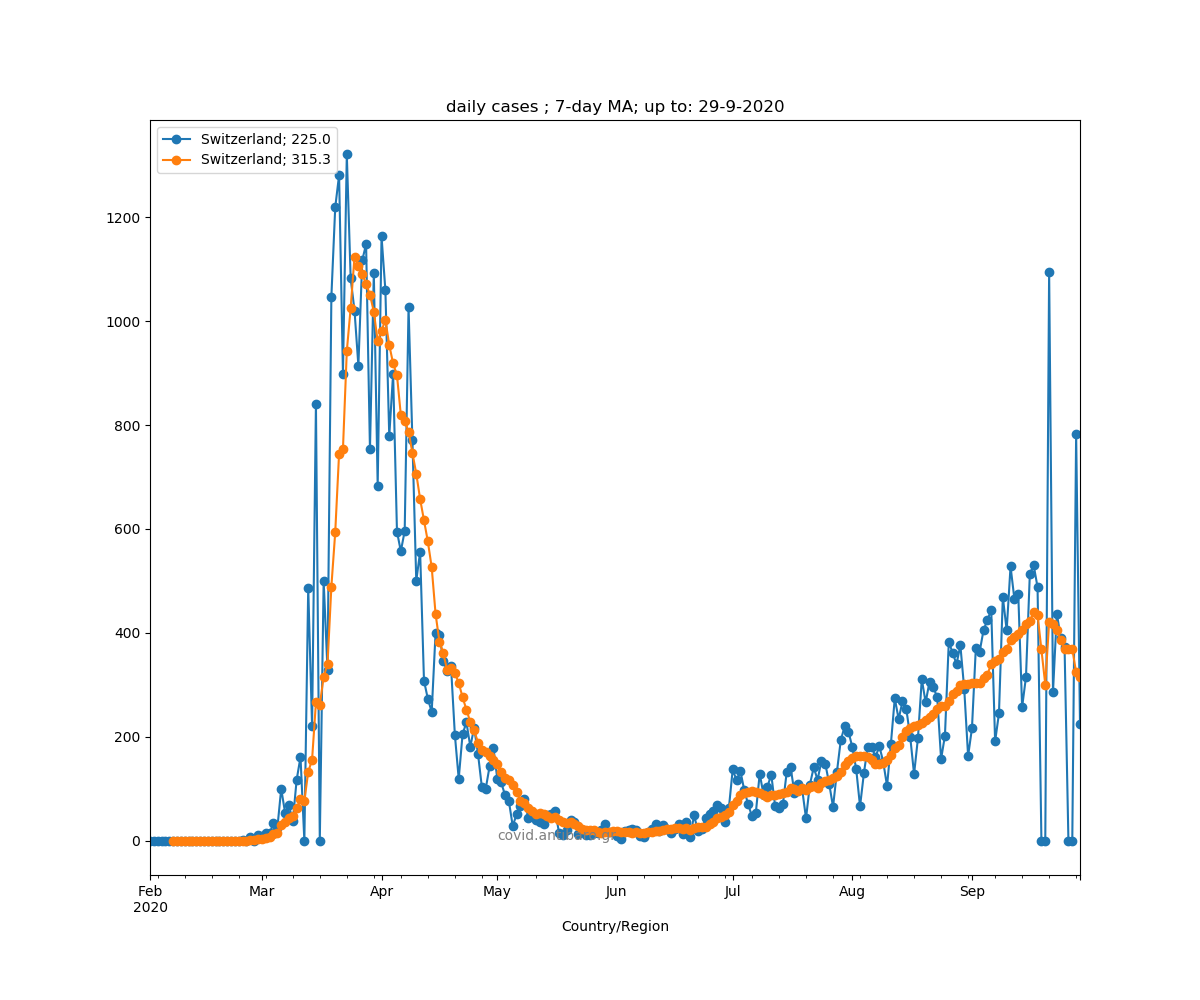
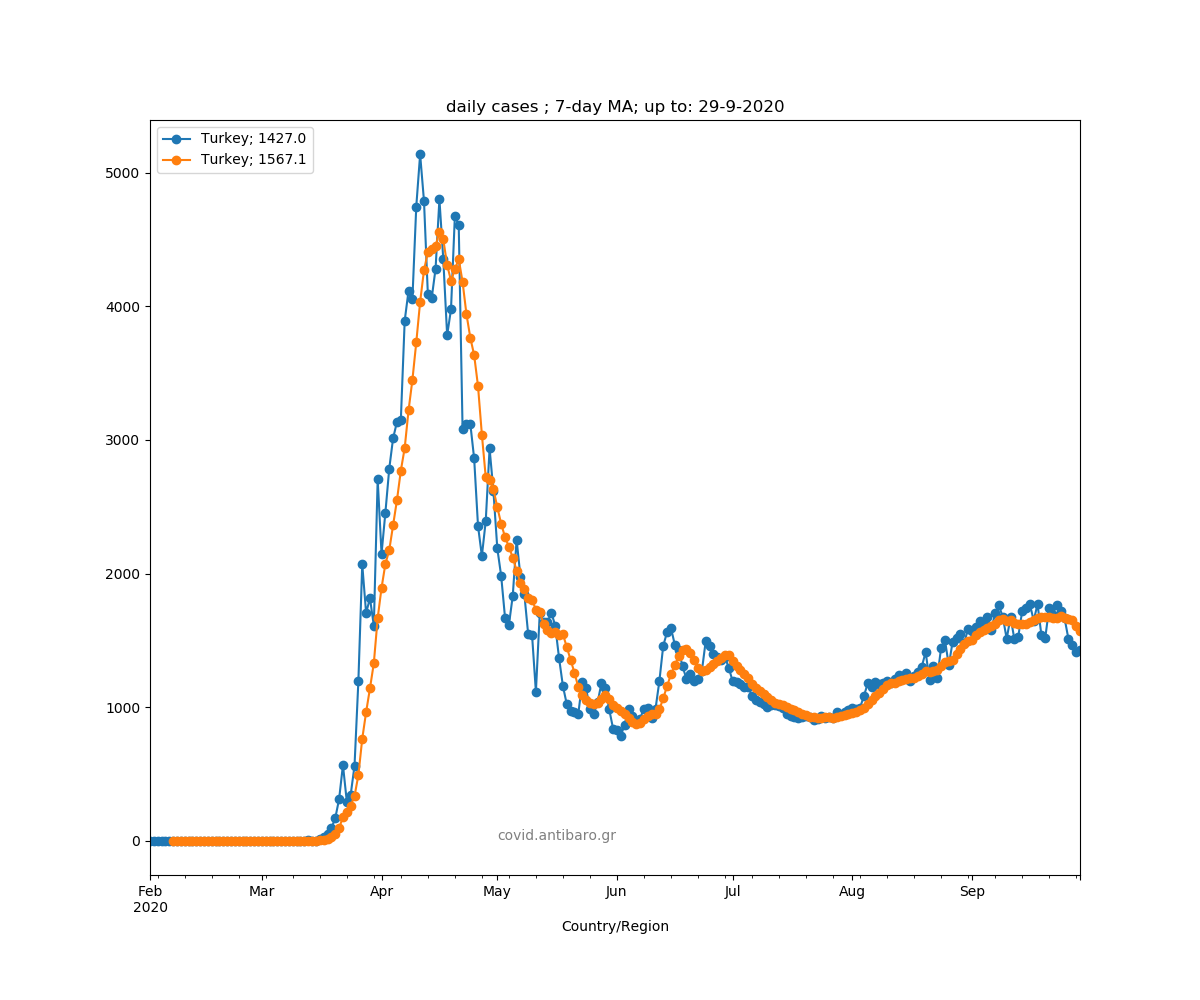
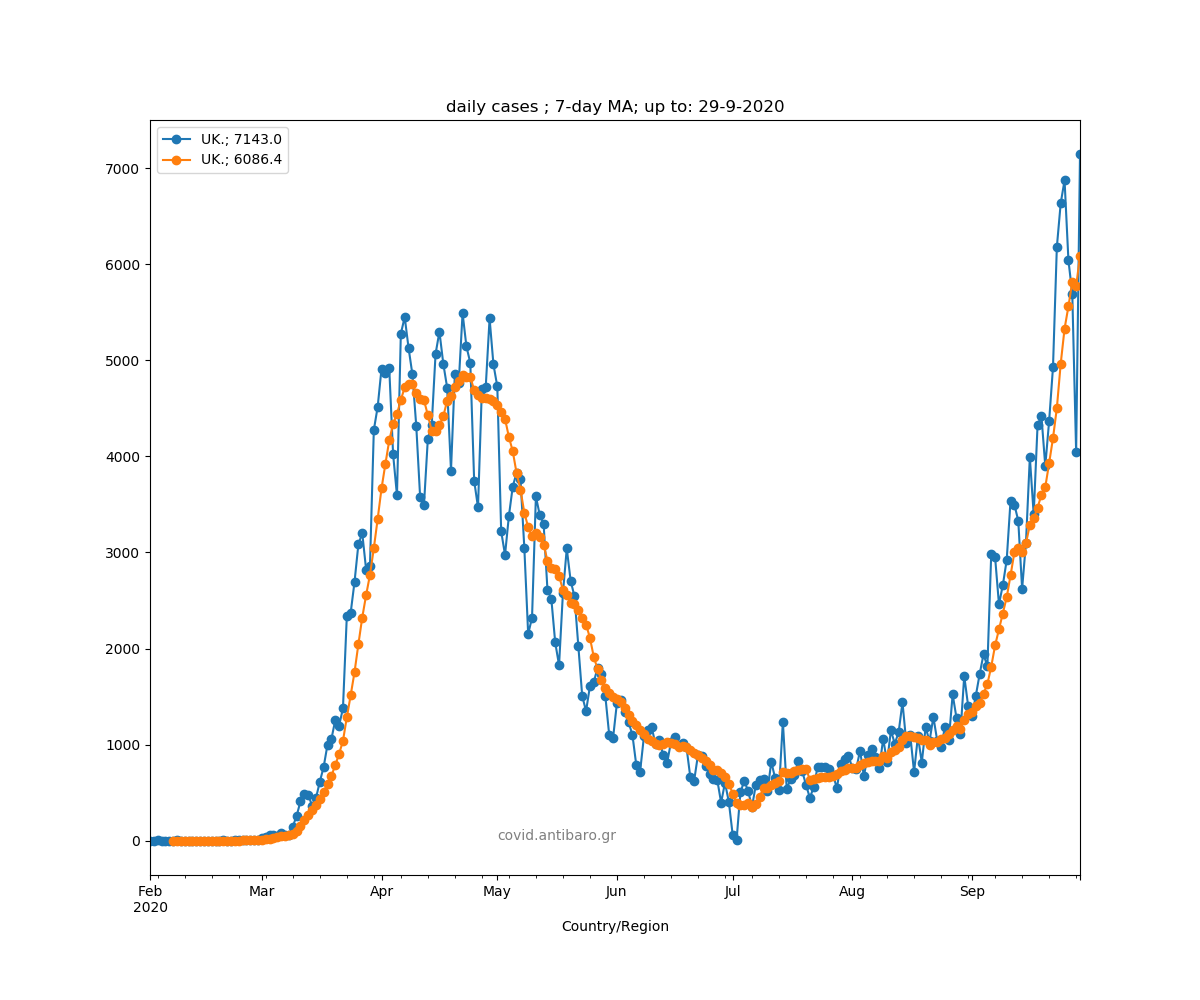
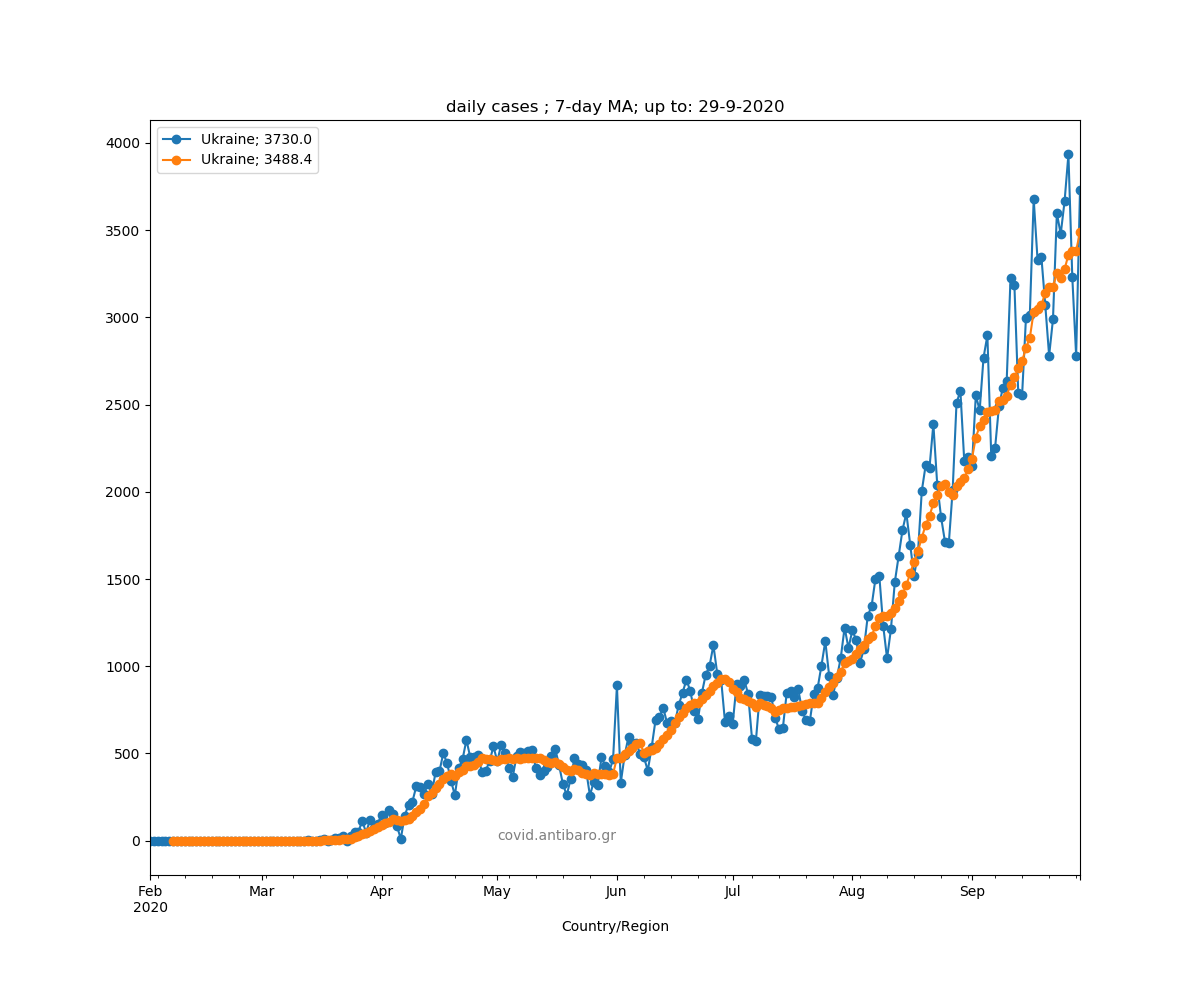
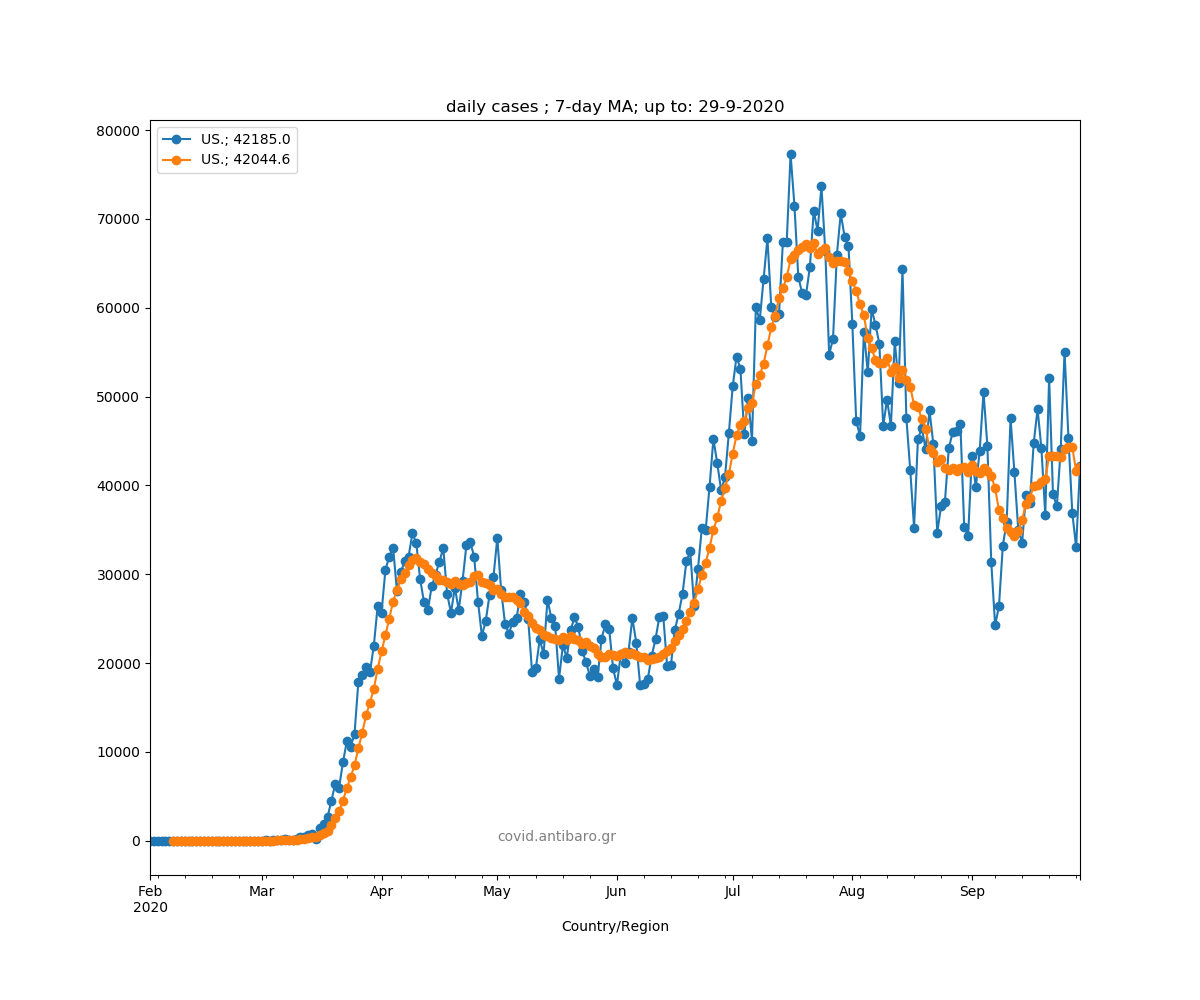
Daily confirmed cases plus 7-day average for 42 countries in alphabetical order. Blue is the daily value, orange is the 7-day moving average. In the legend, you see the latest values, as of 29th Sep 2020
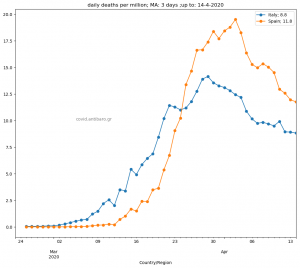
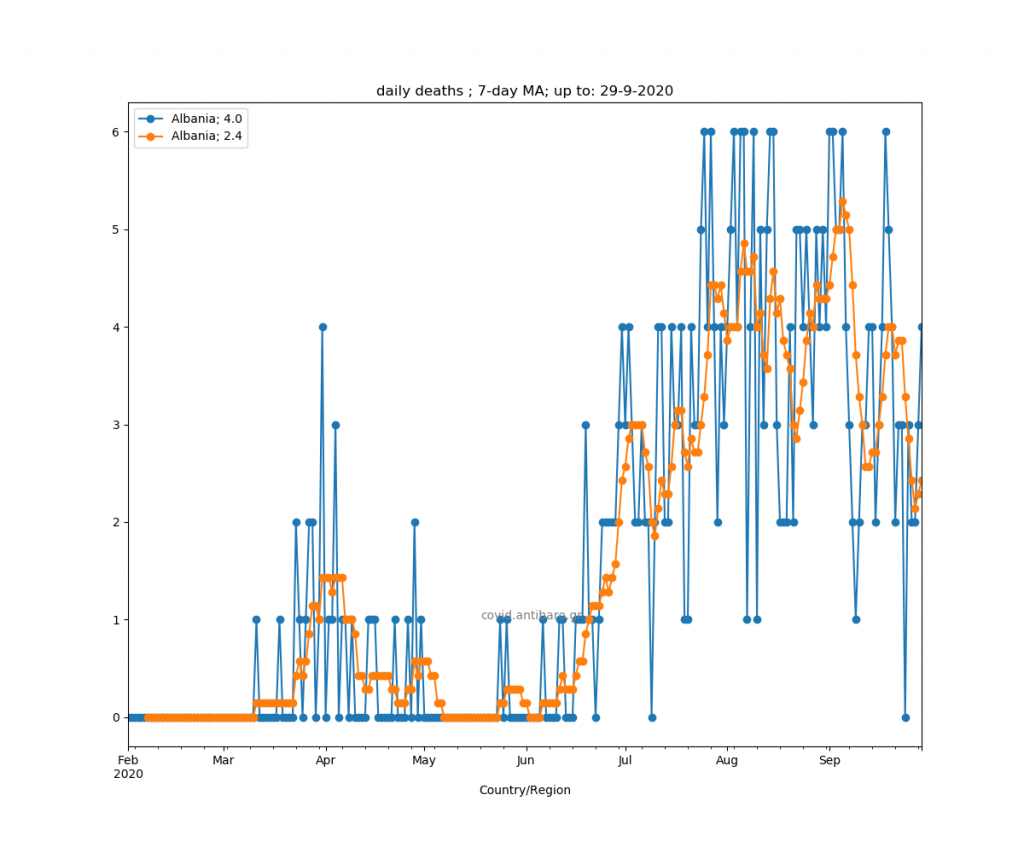
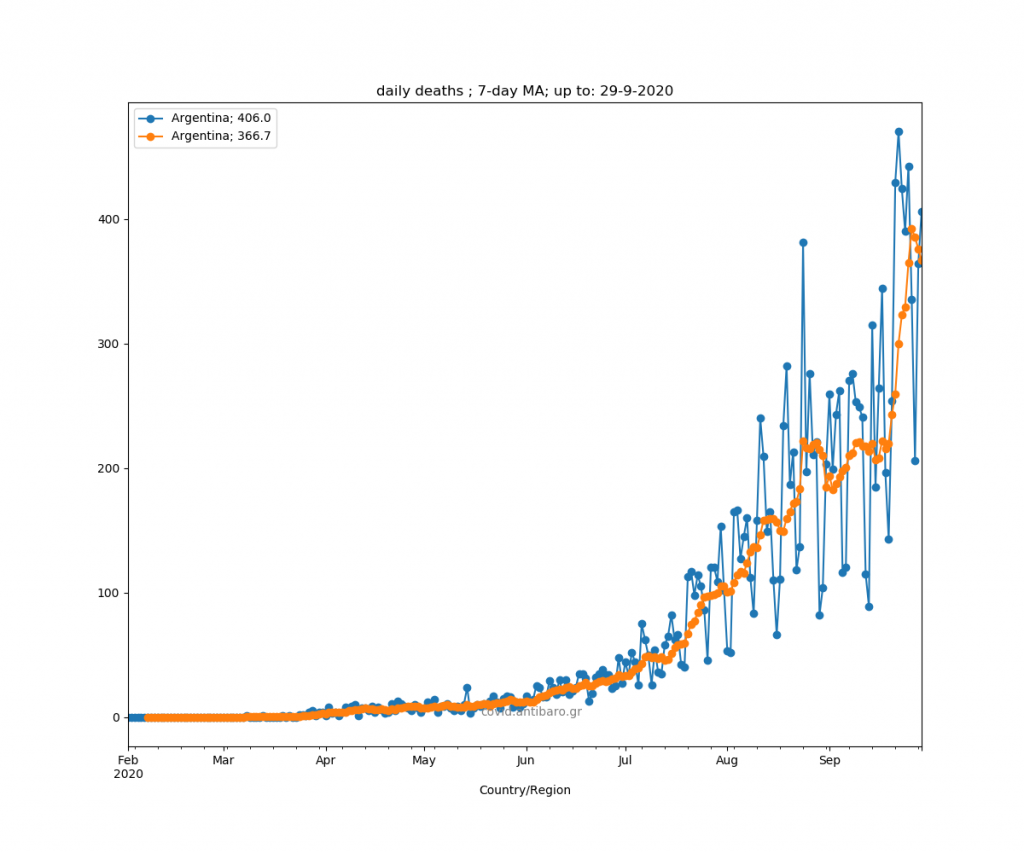
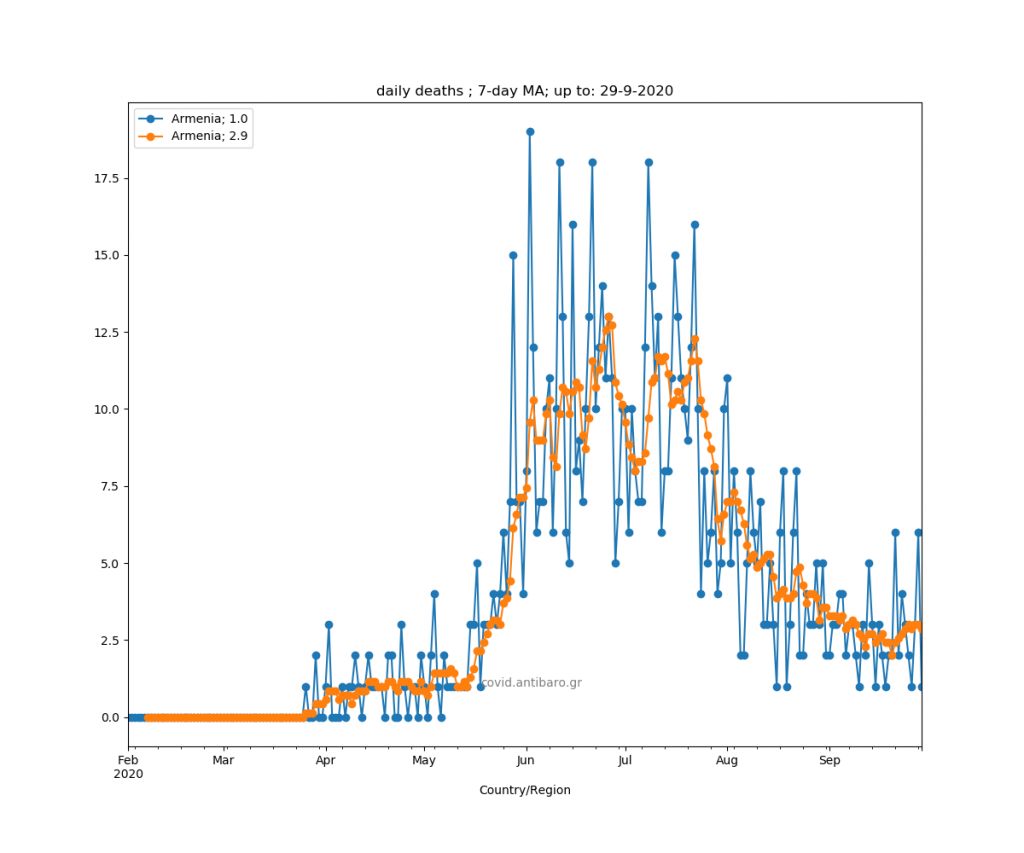
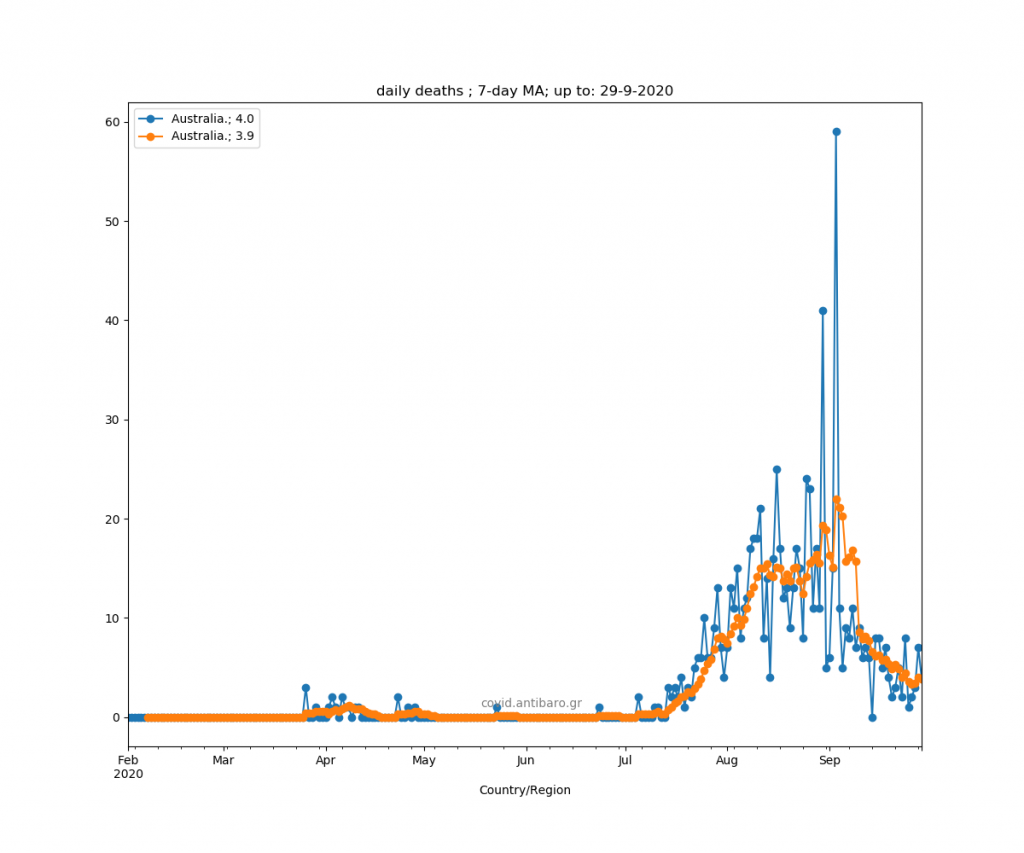
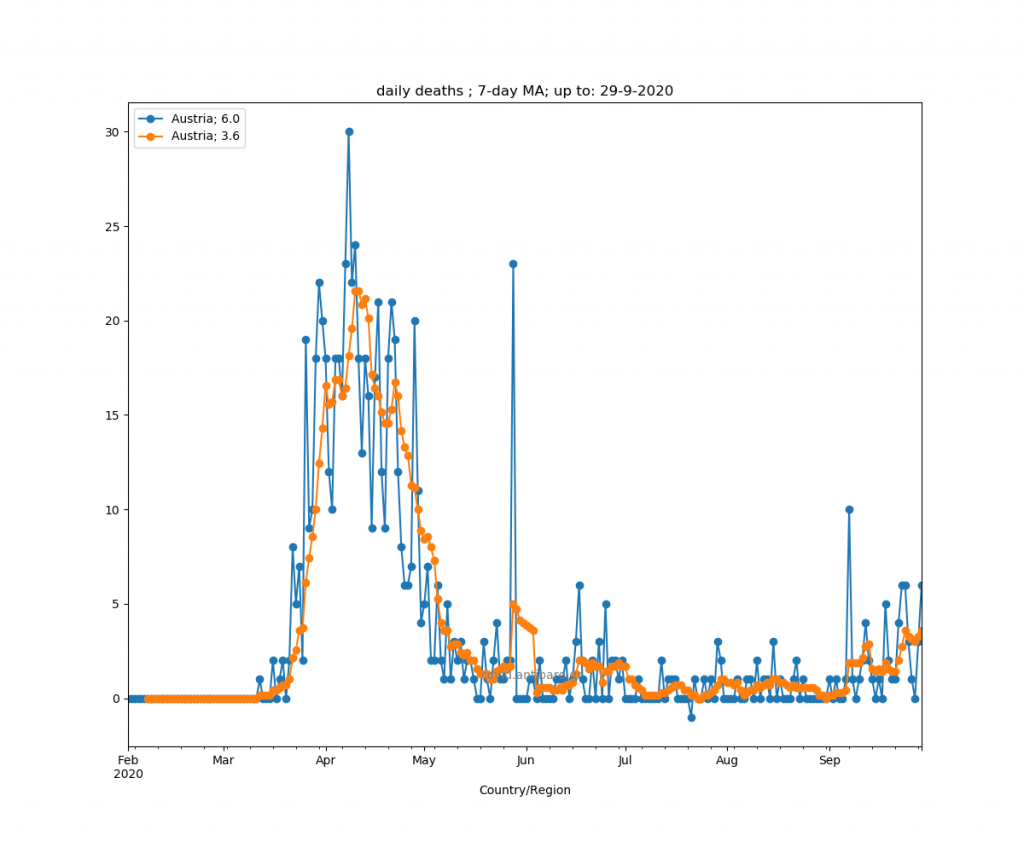
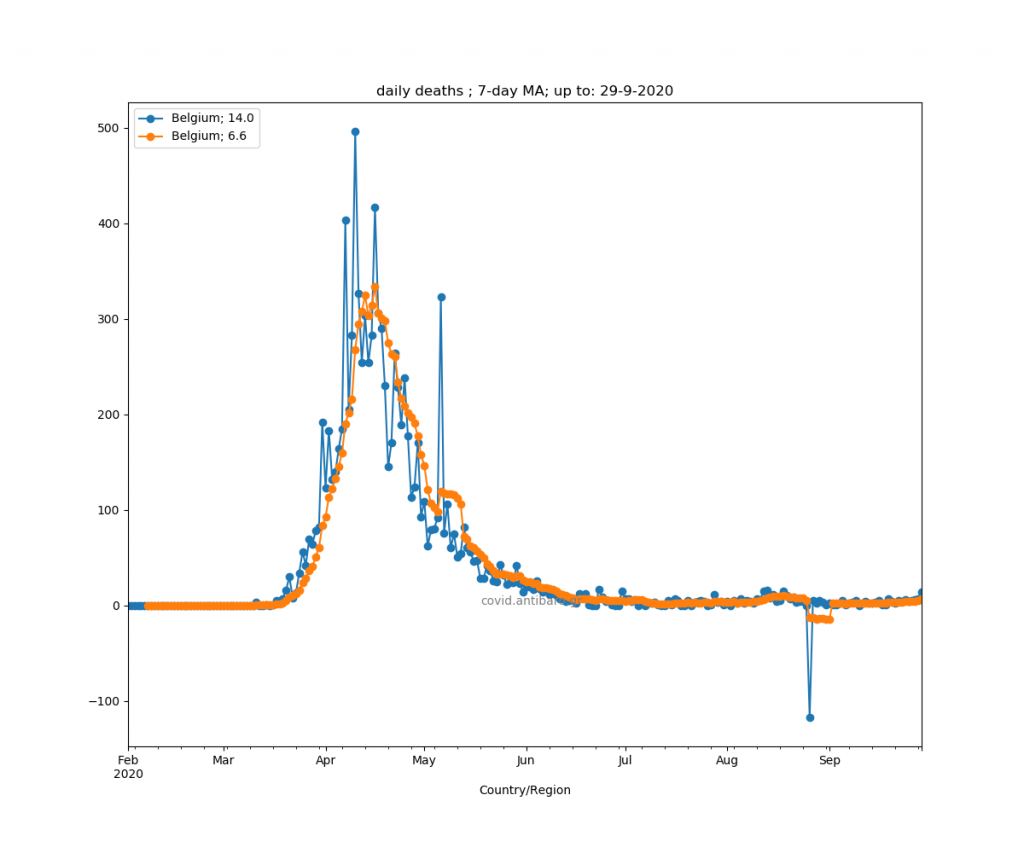
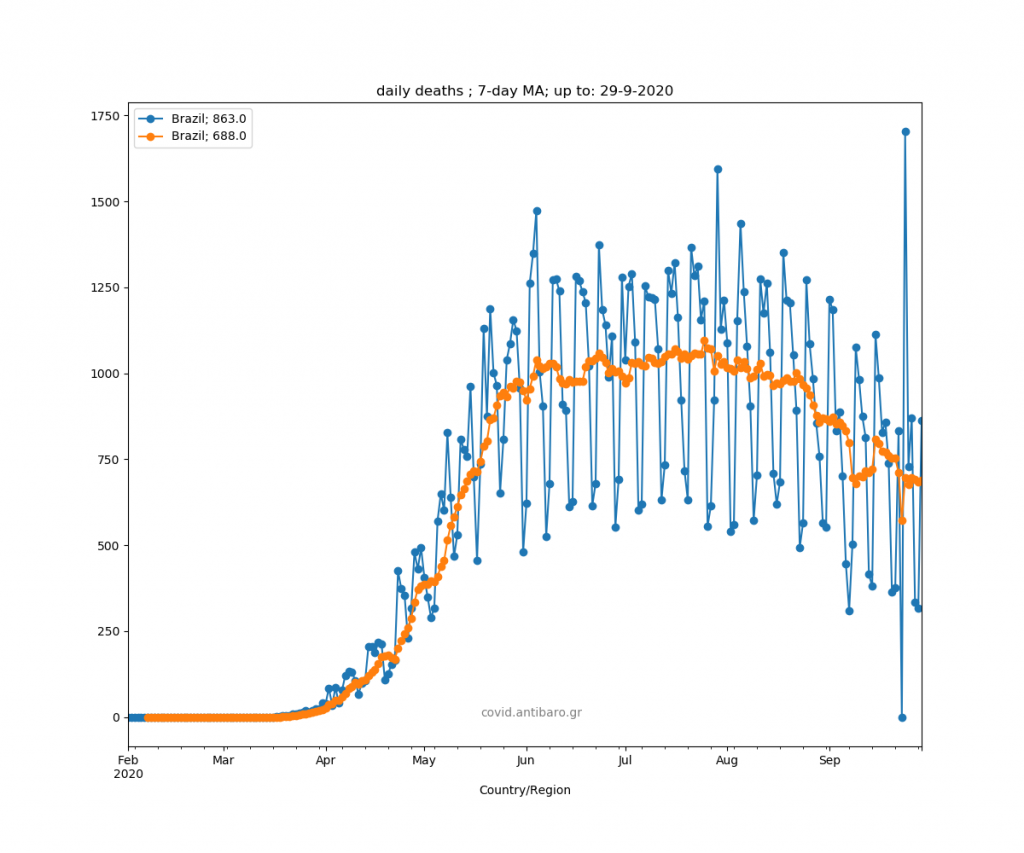
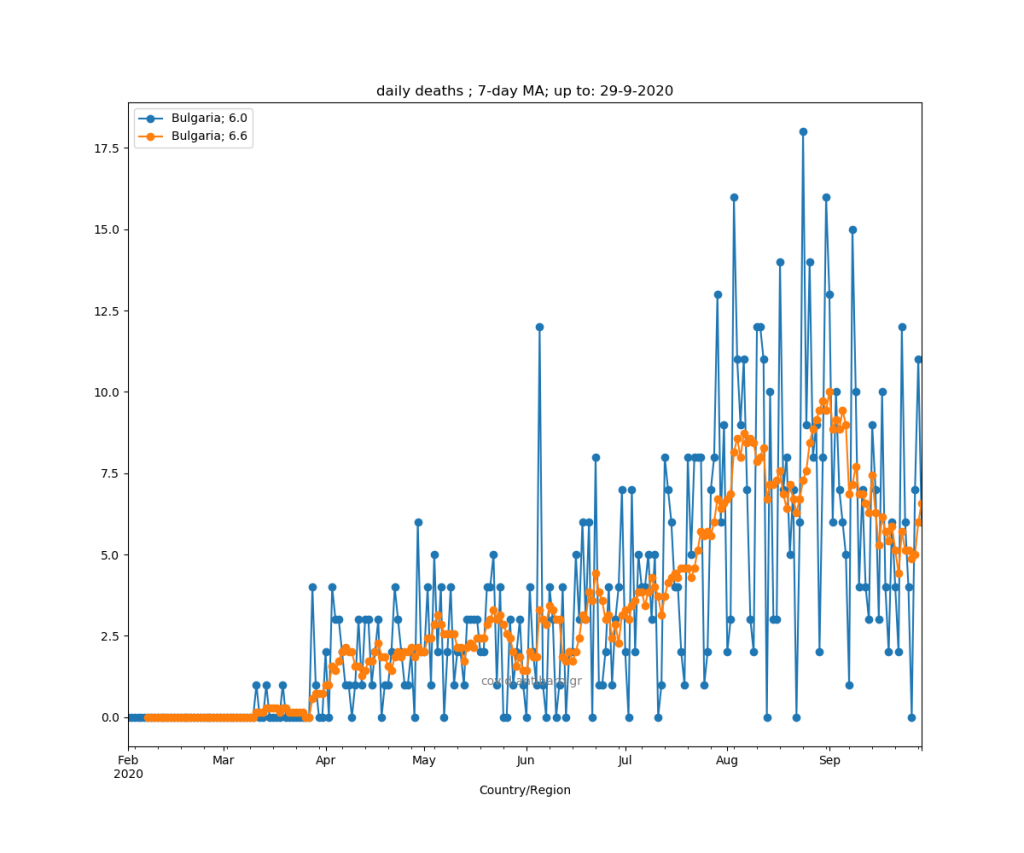
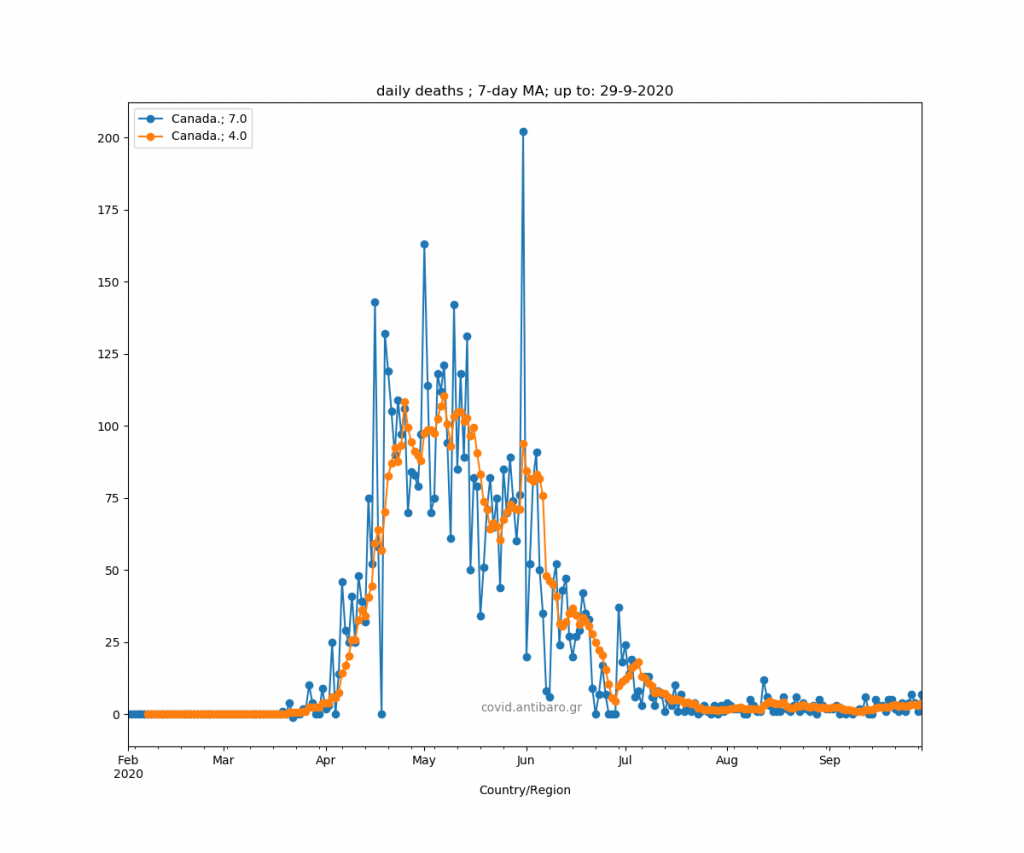
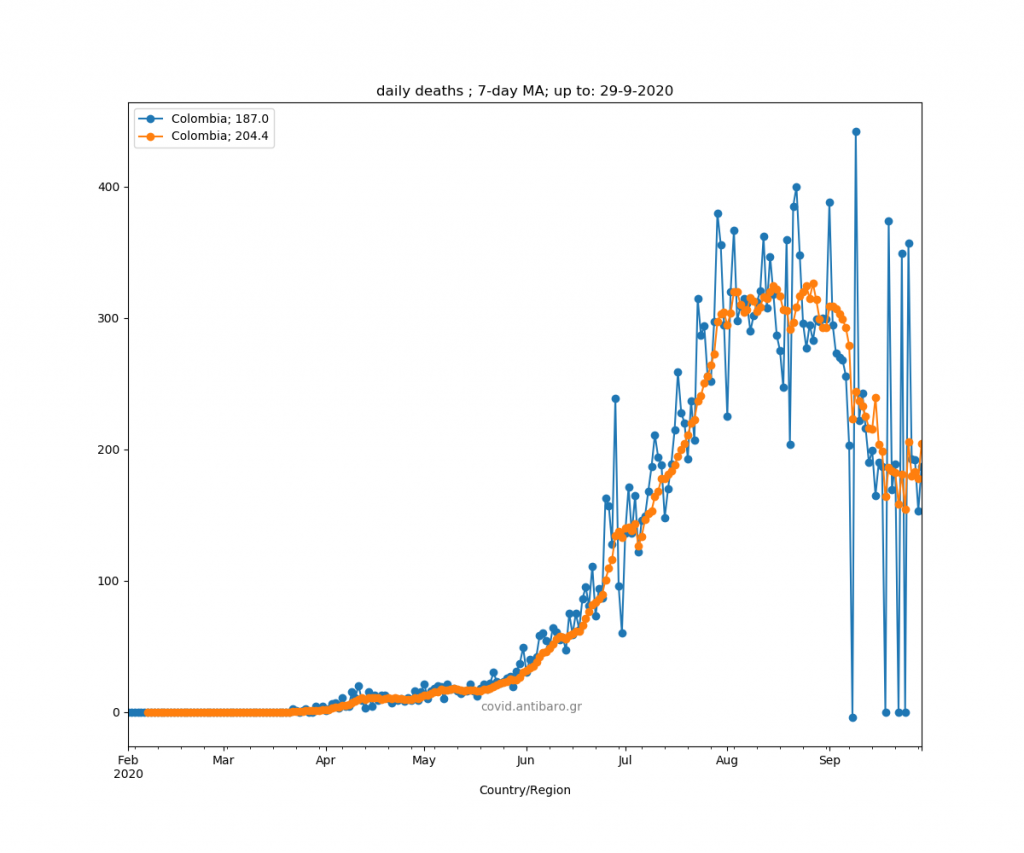
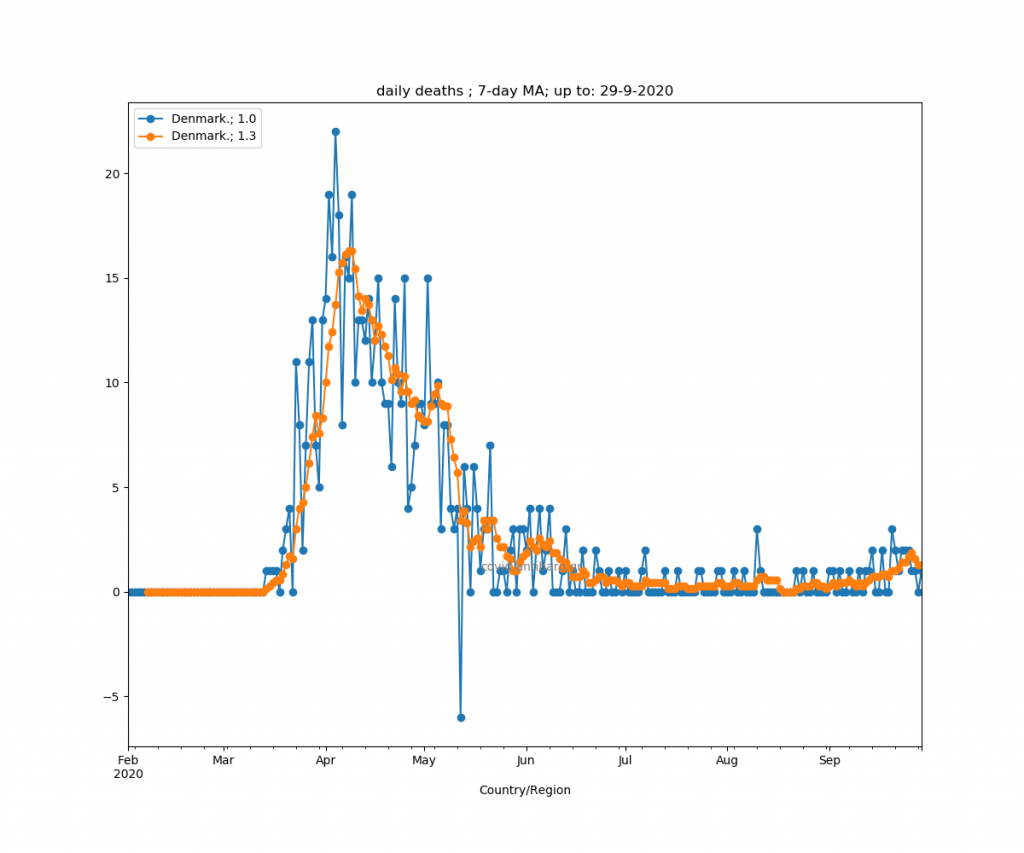
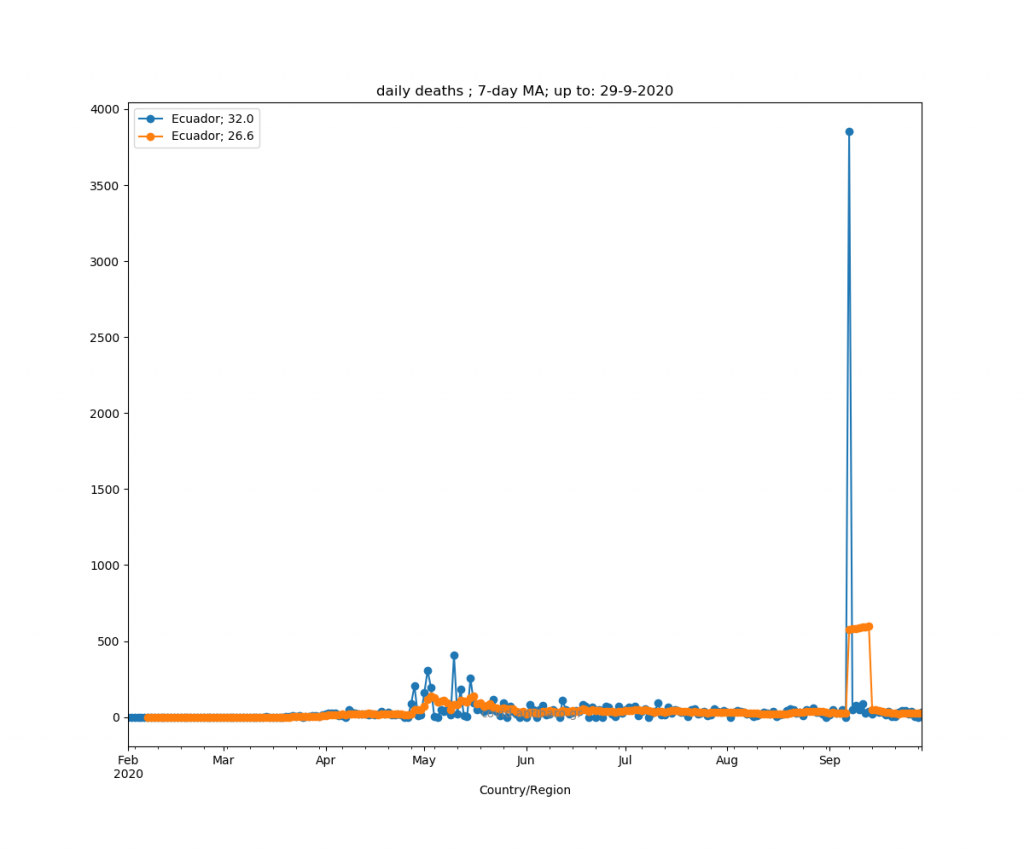
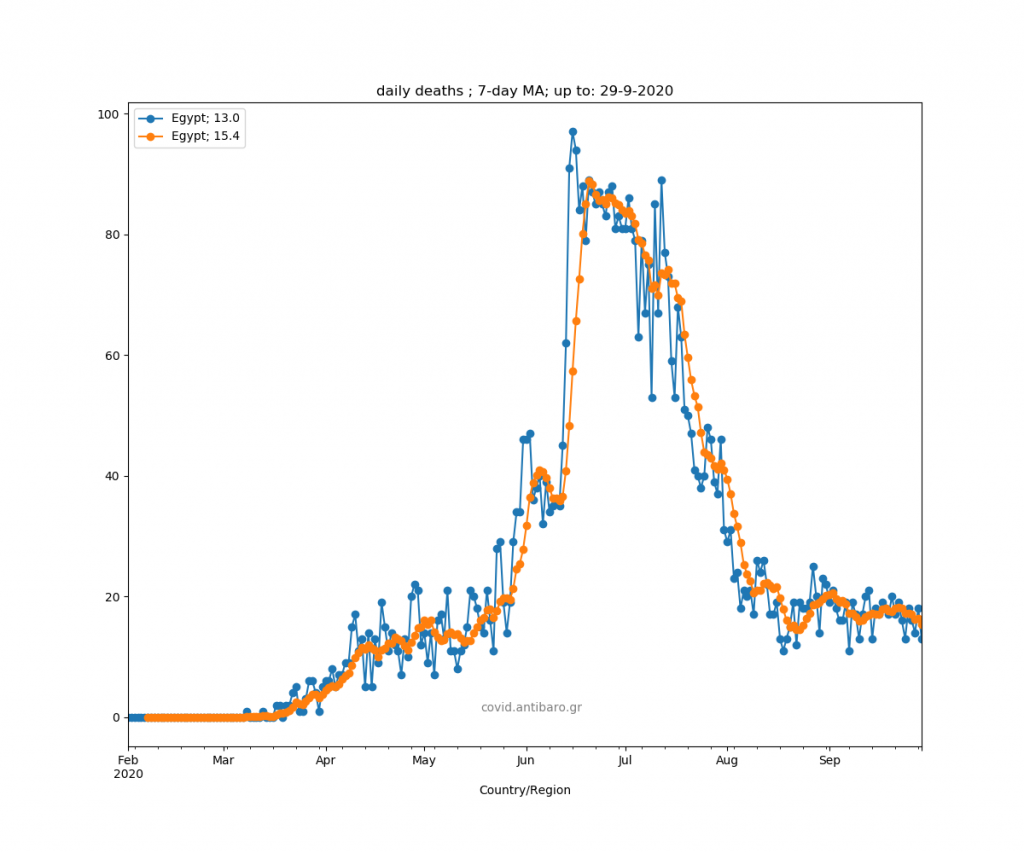
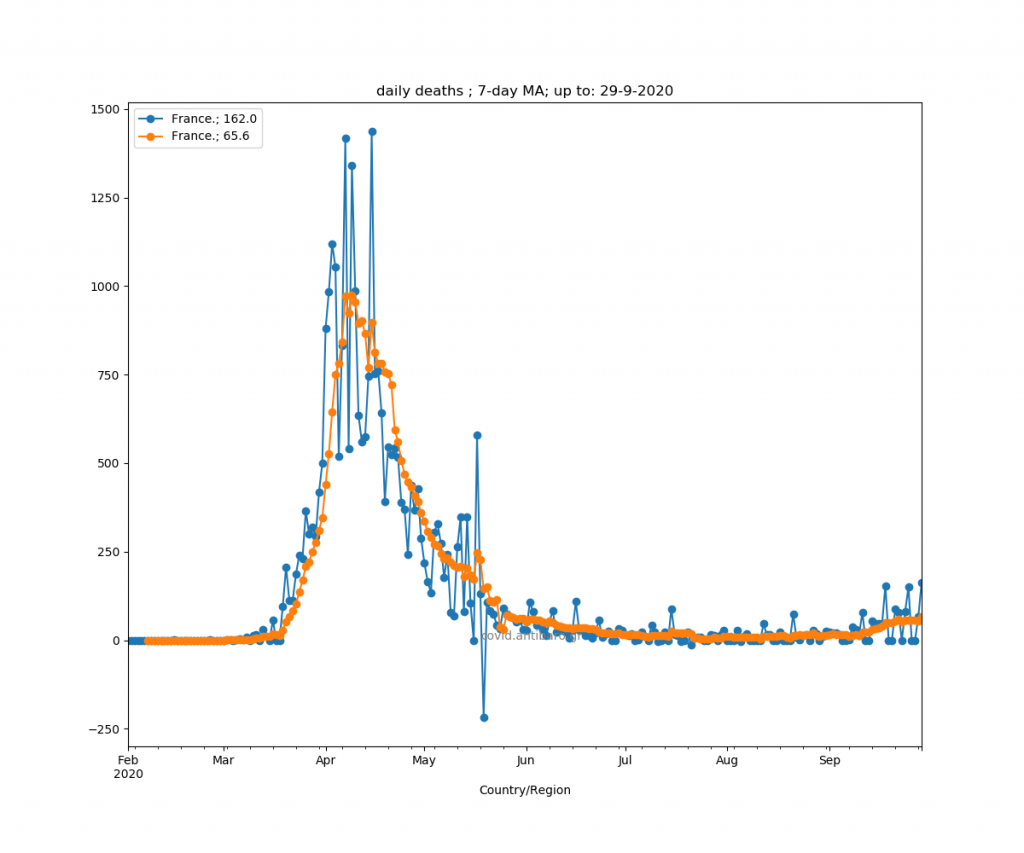
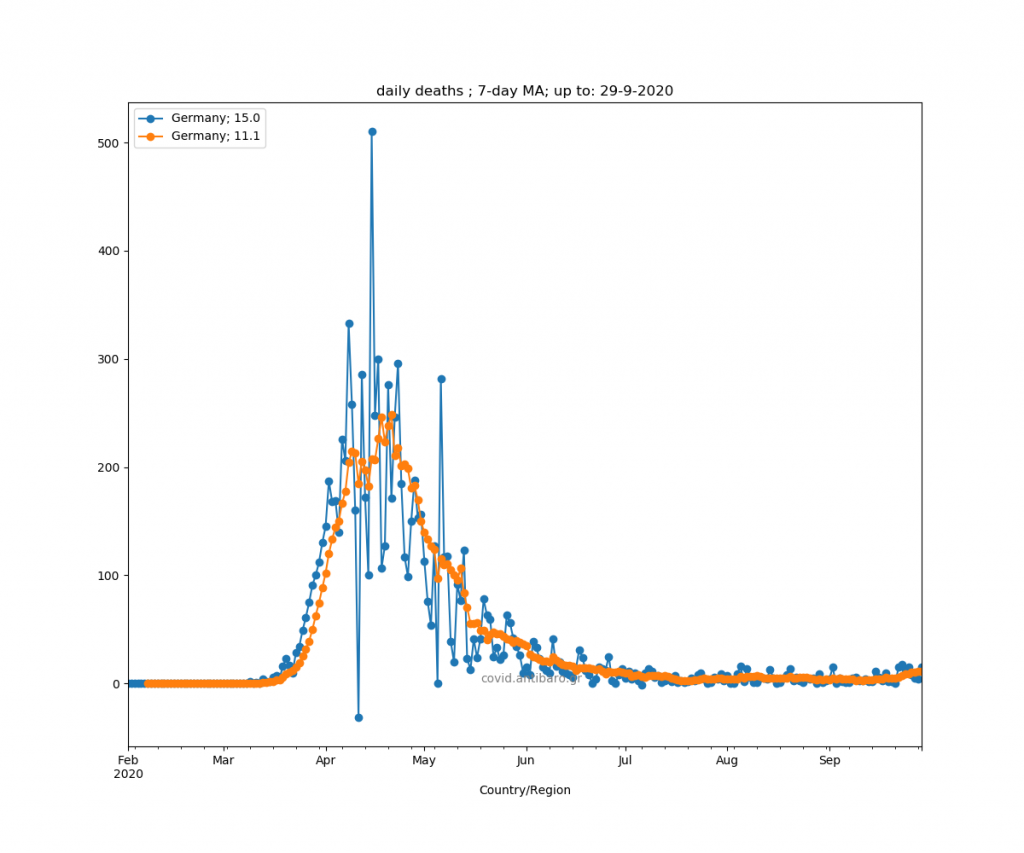
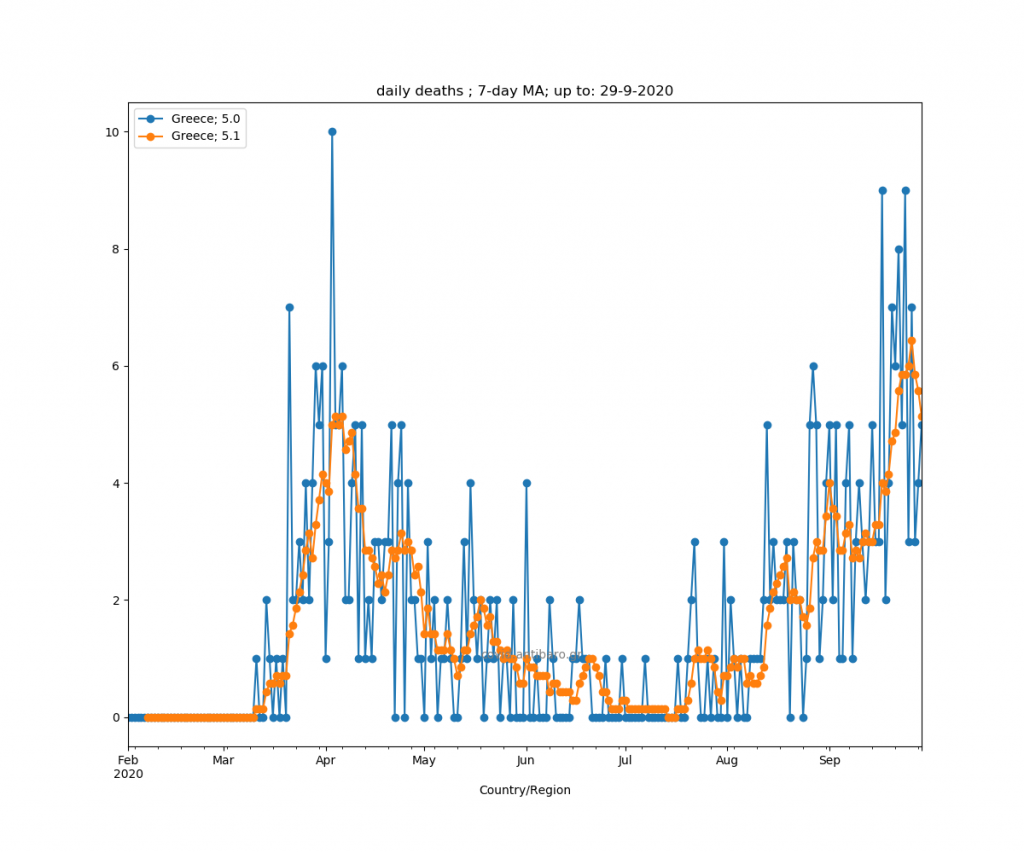
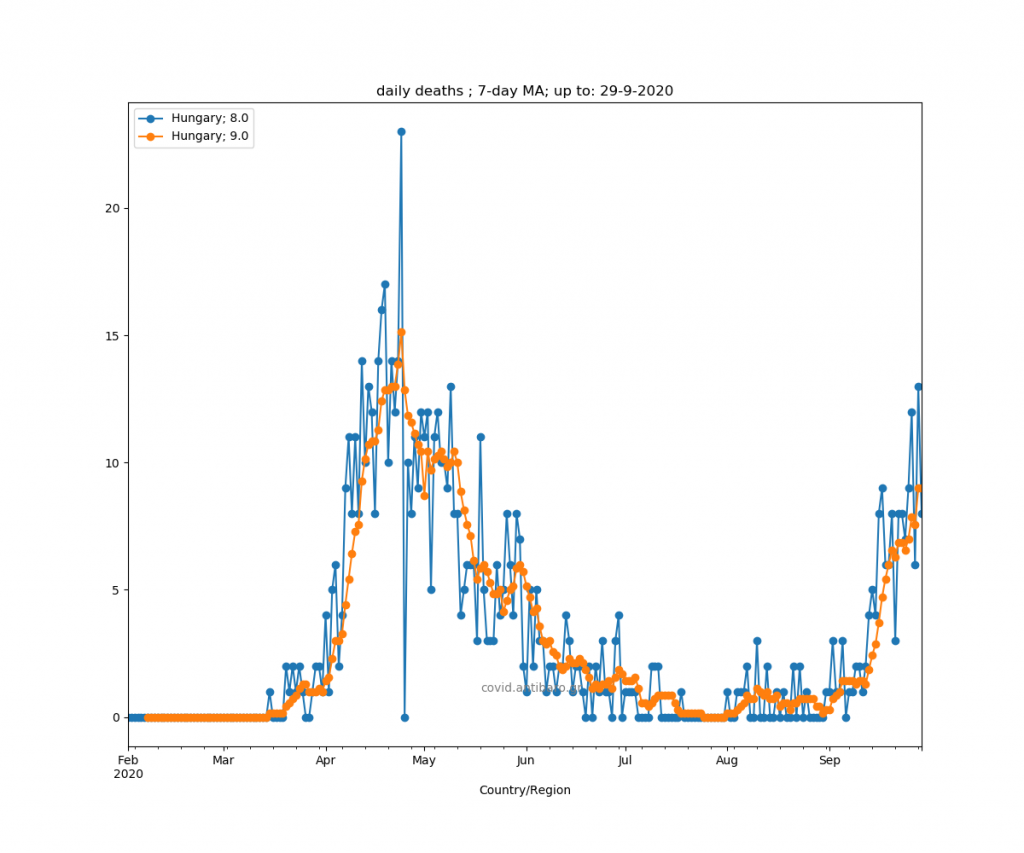
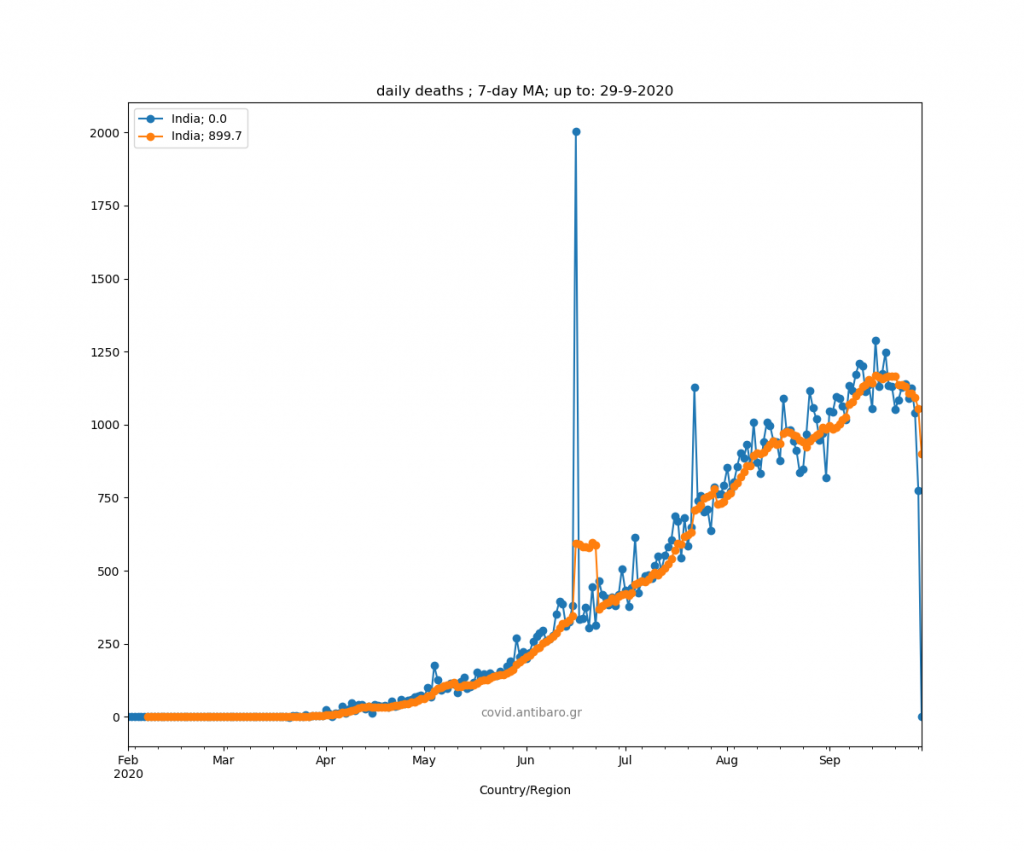
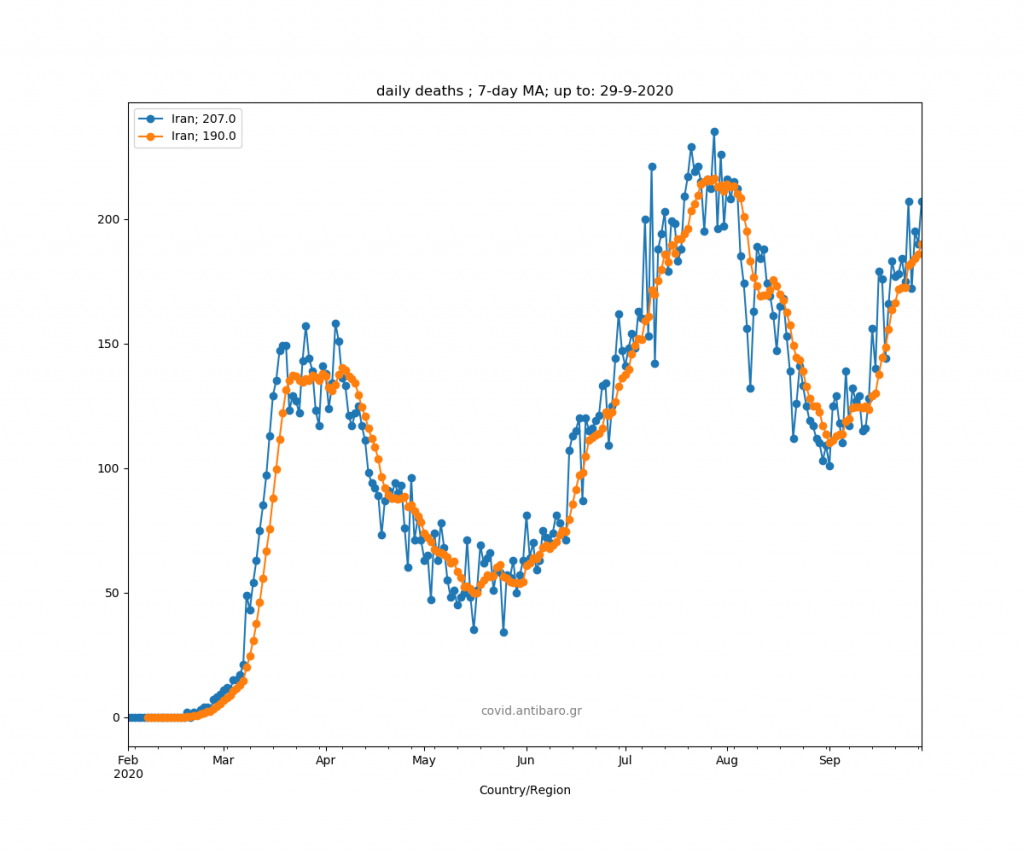
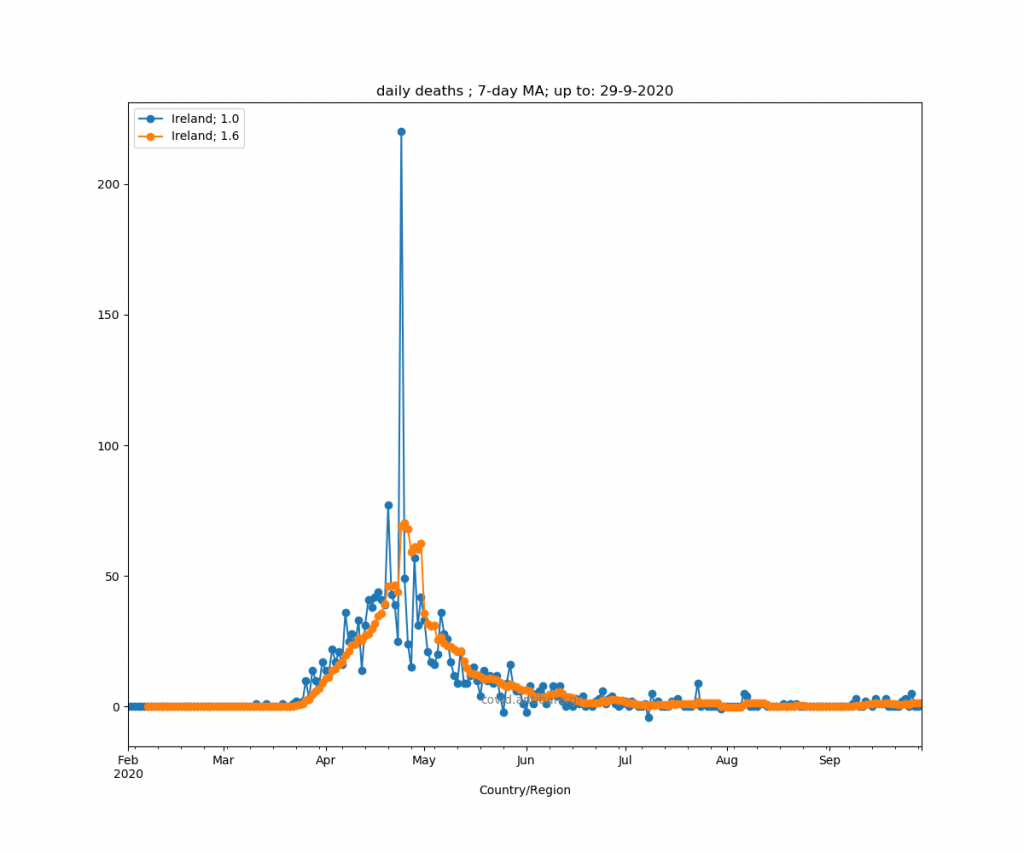
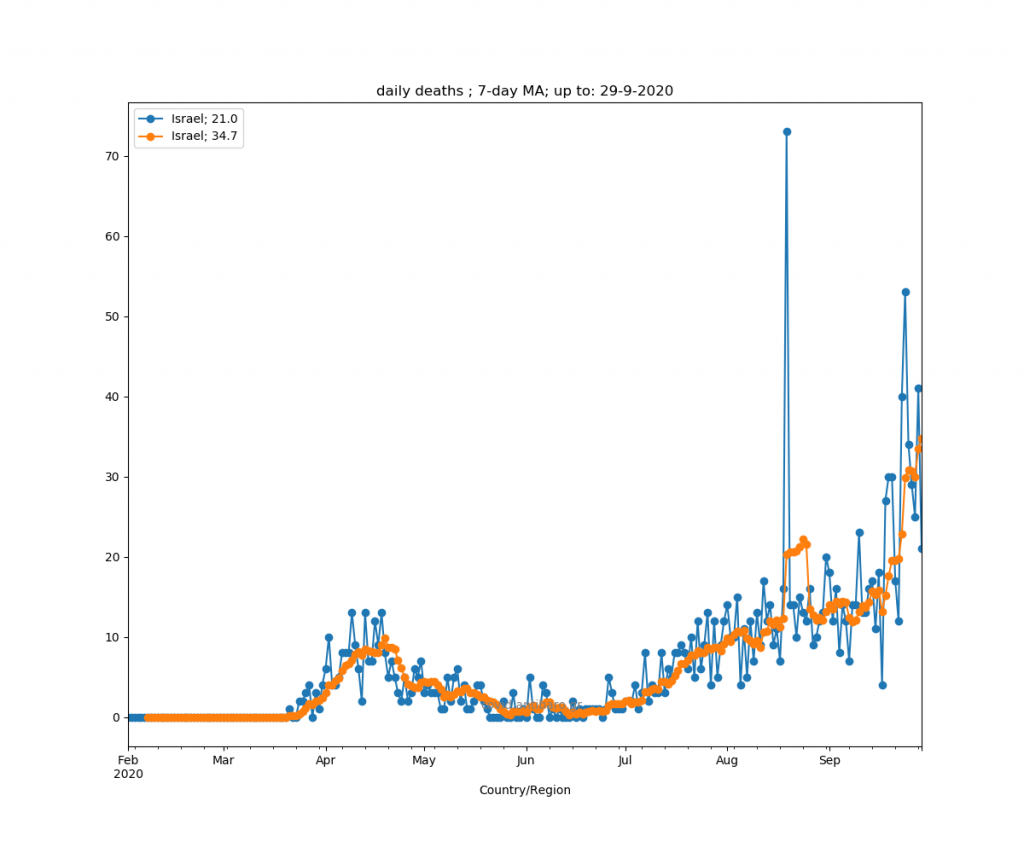
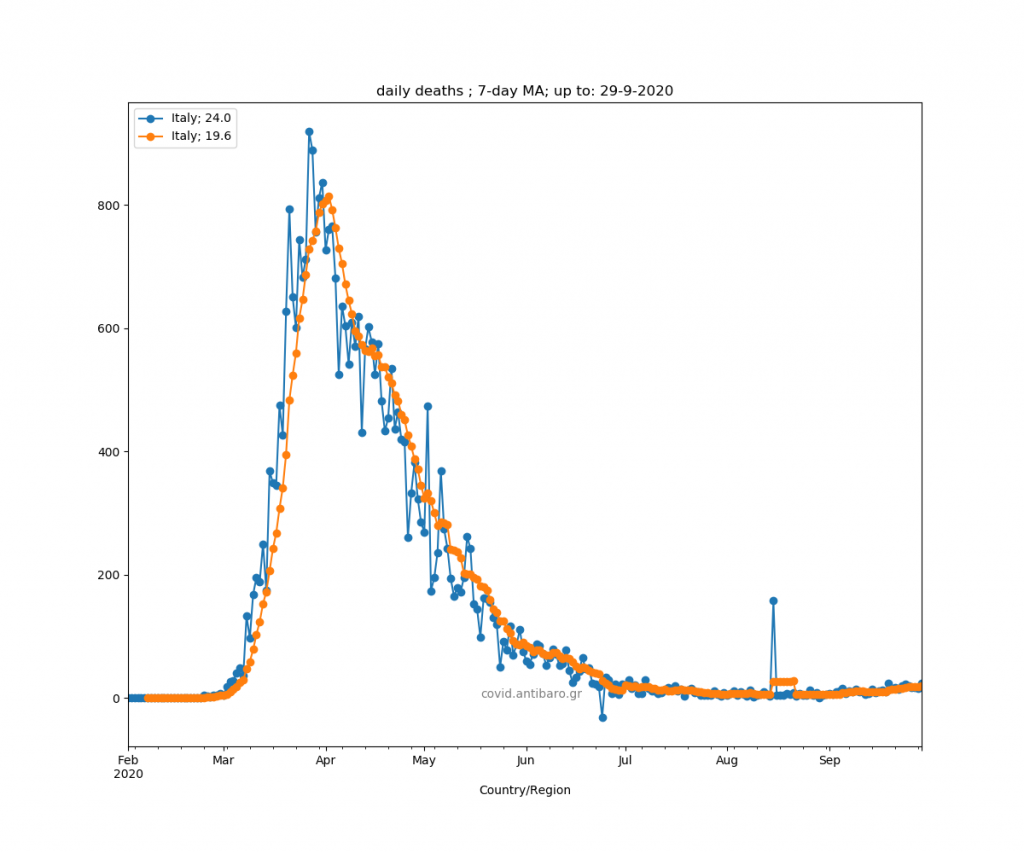
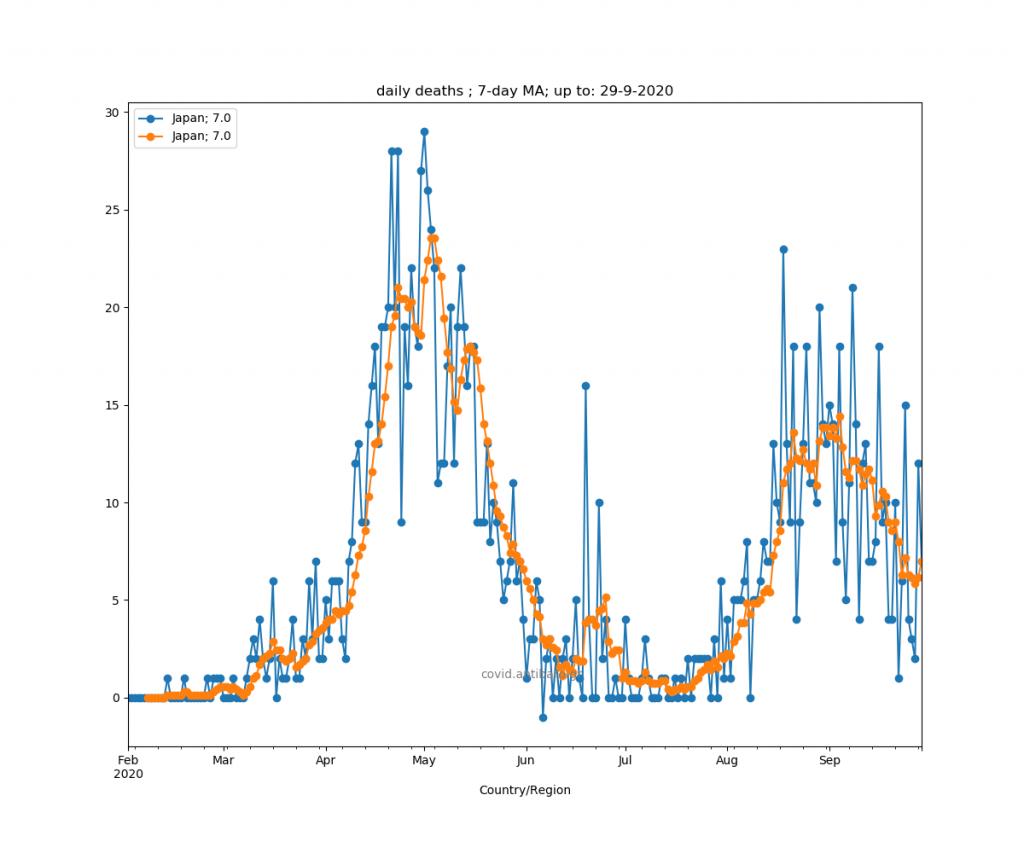
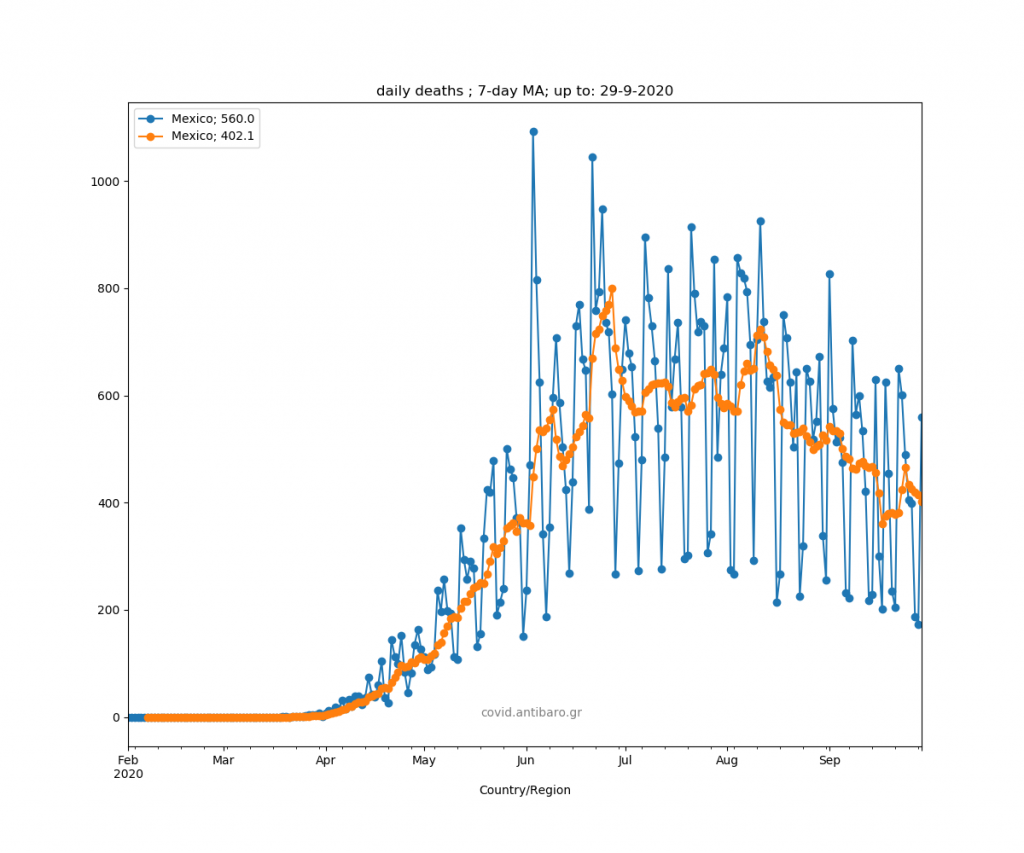
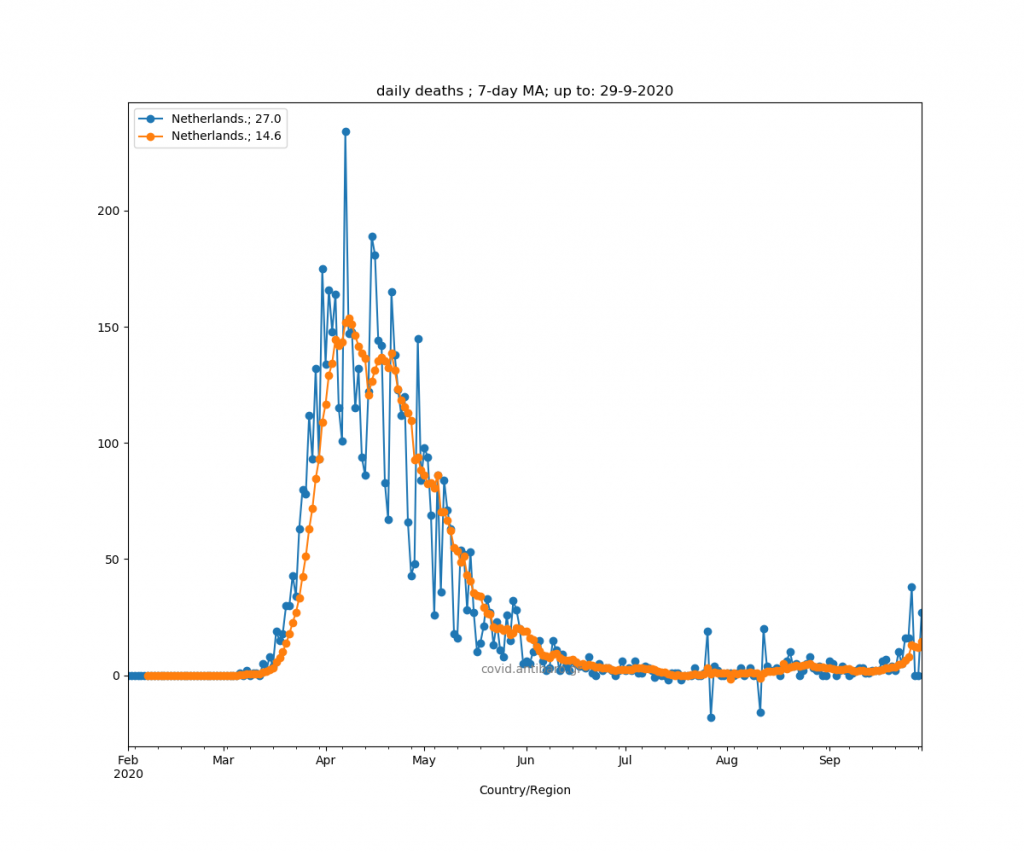
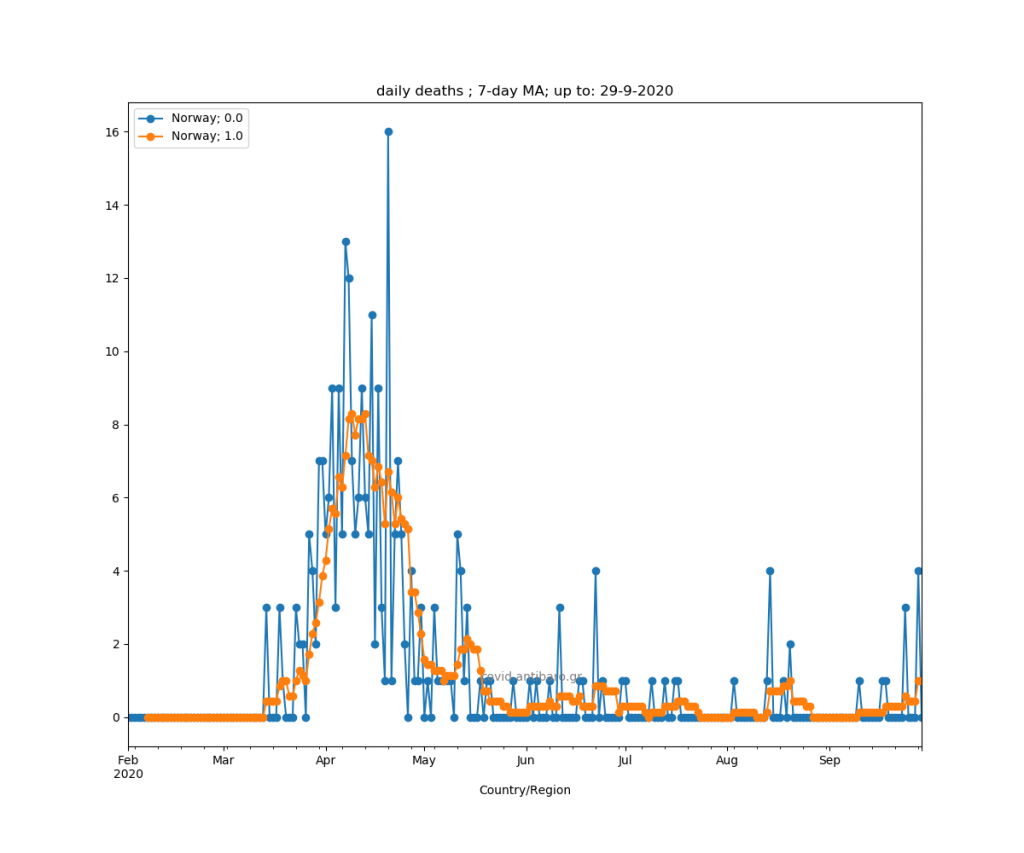
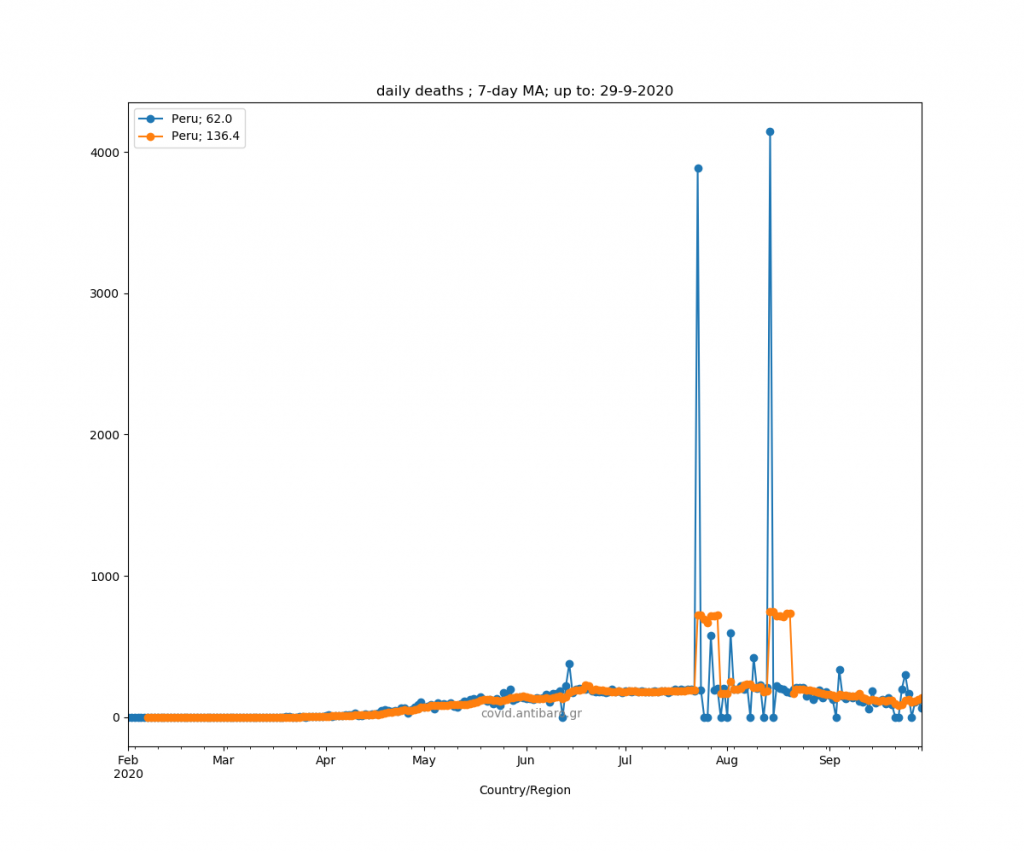
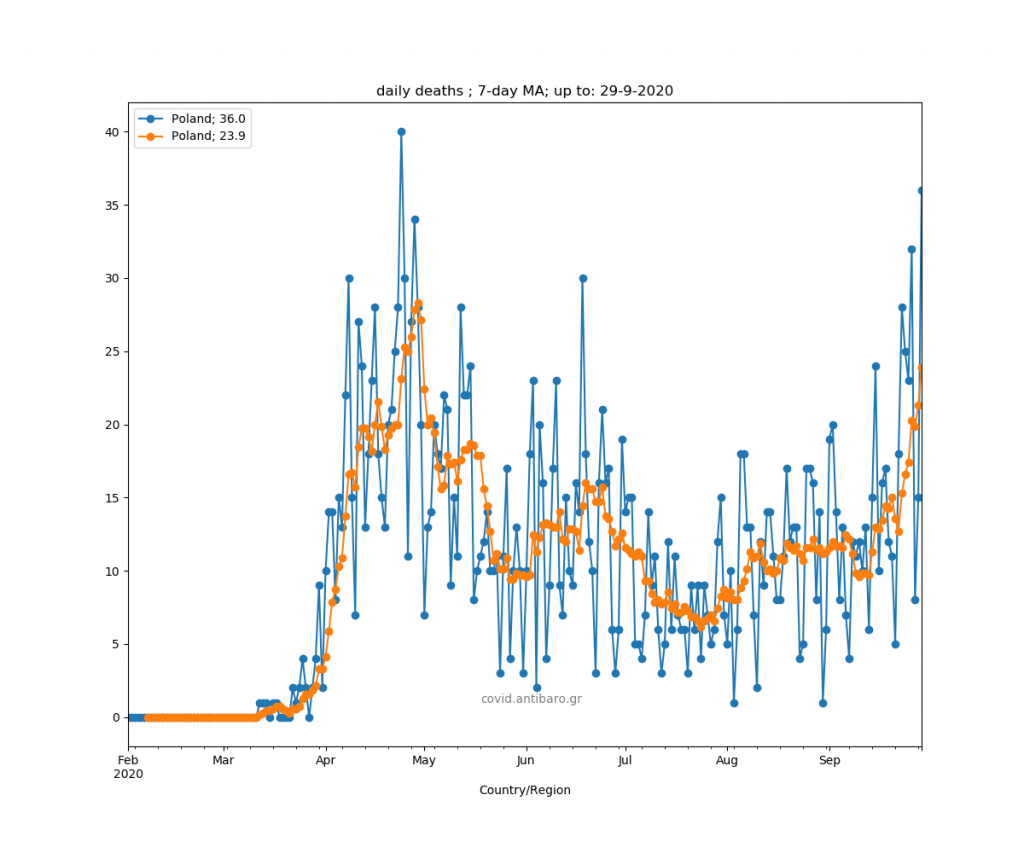
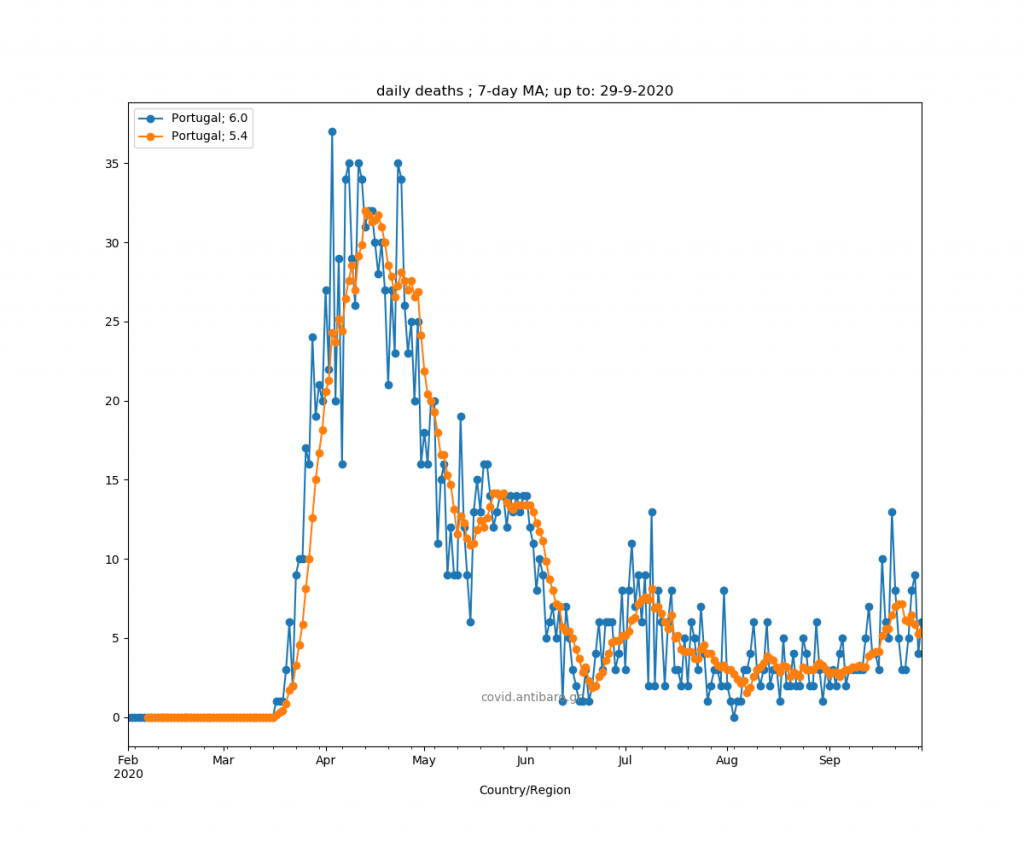
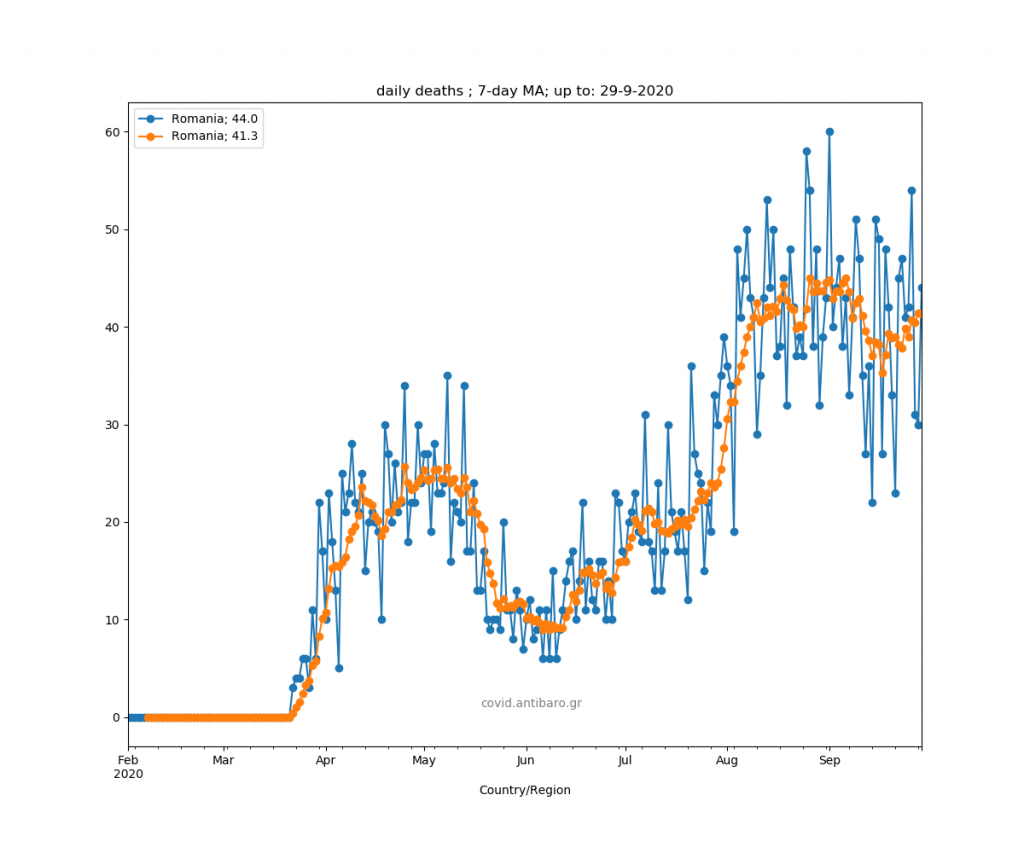
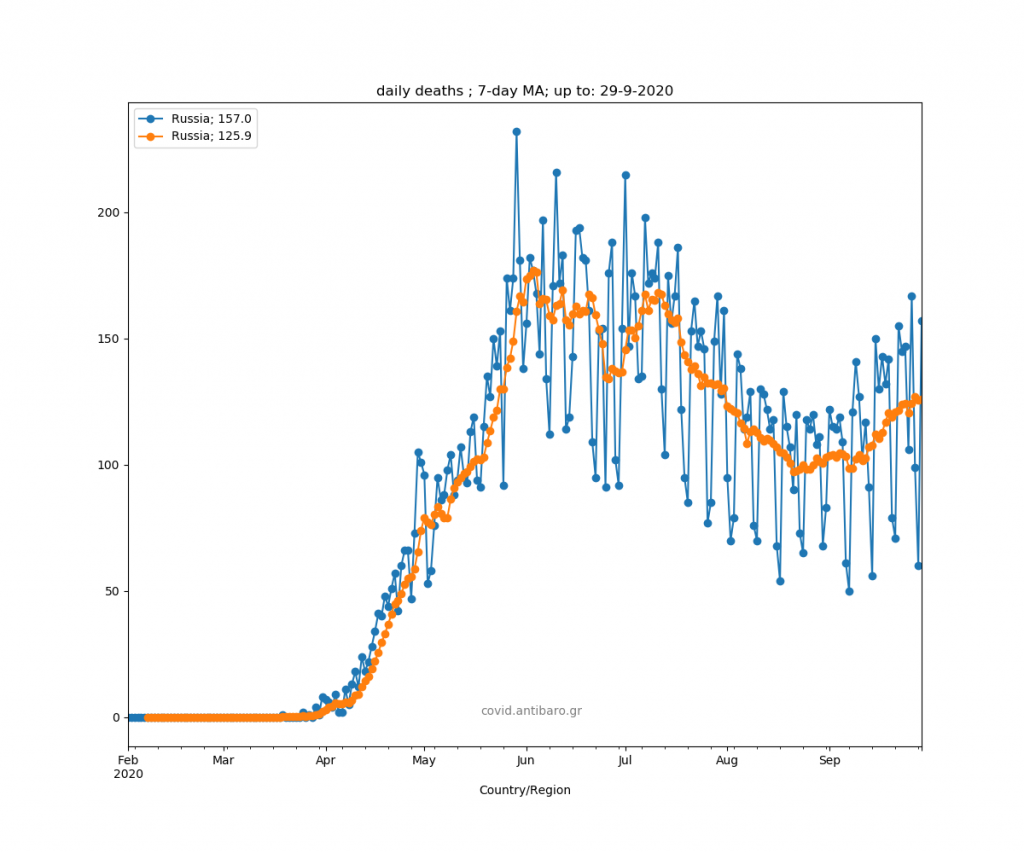
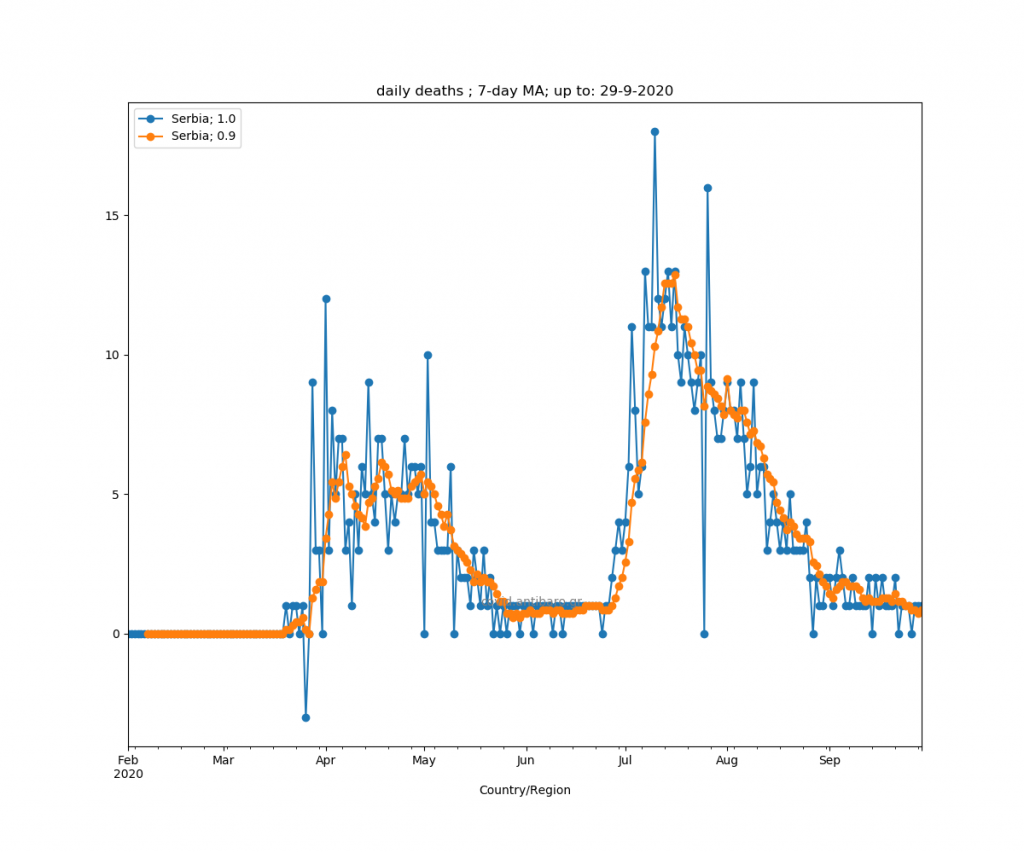
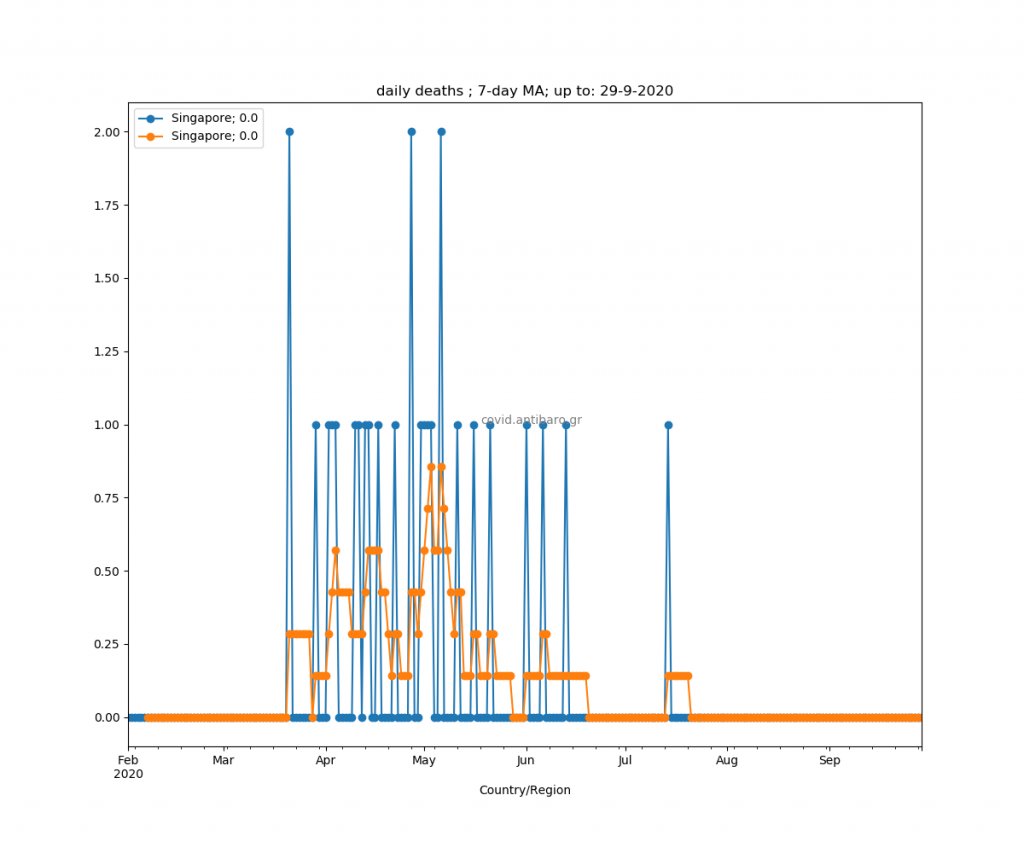
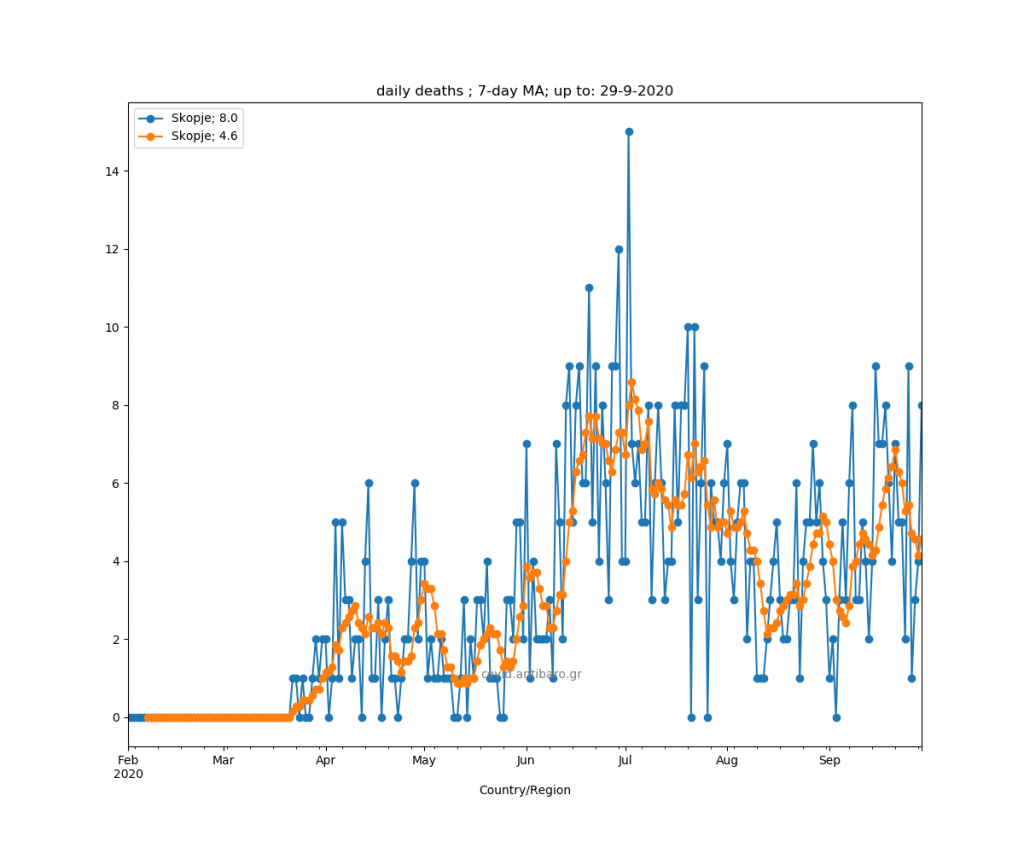
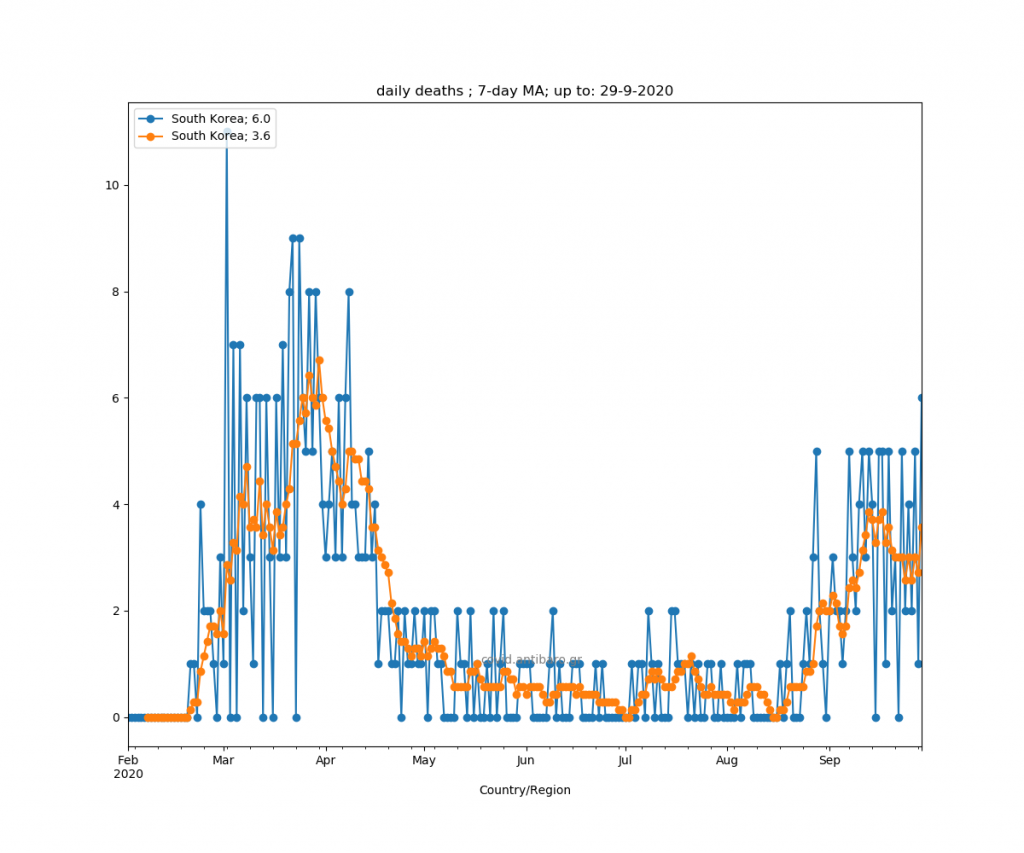
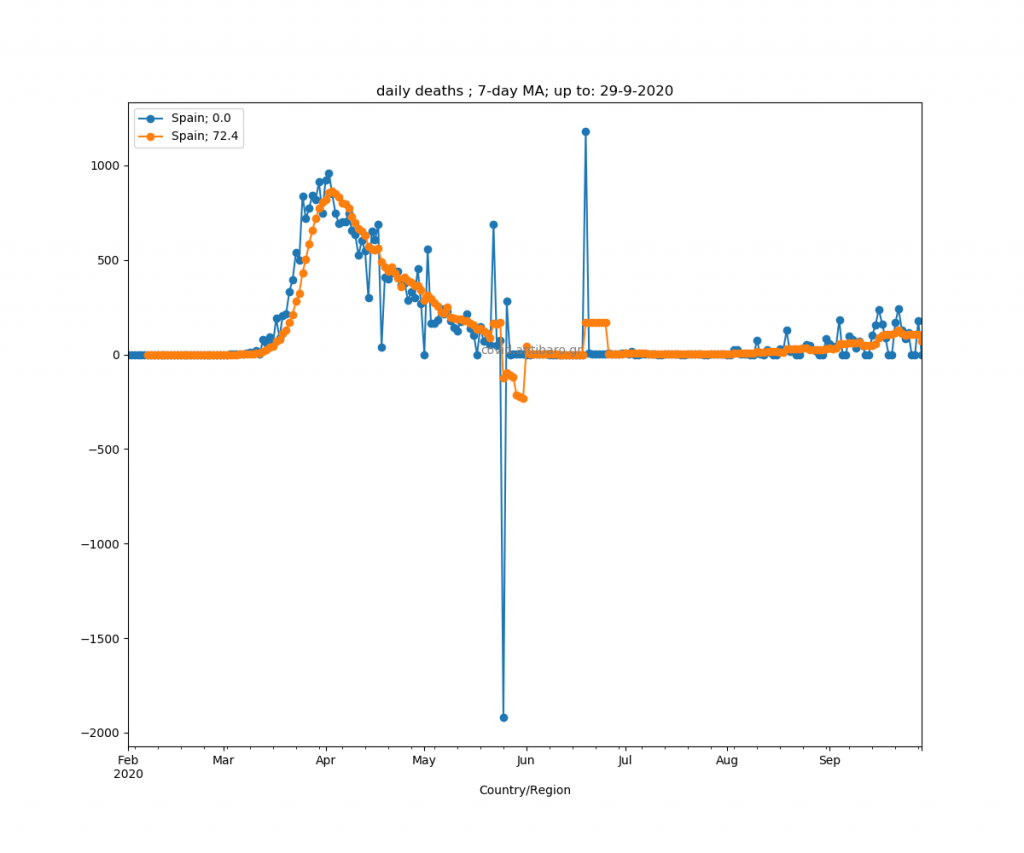
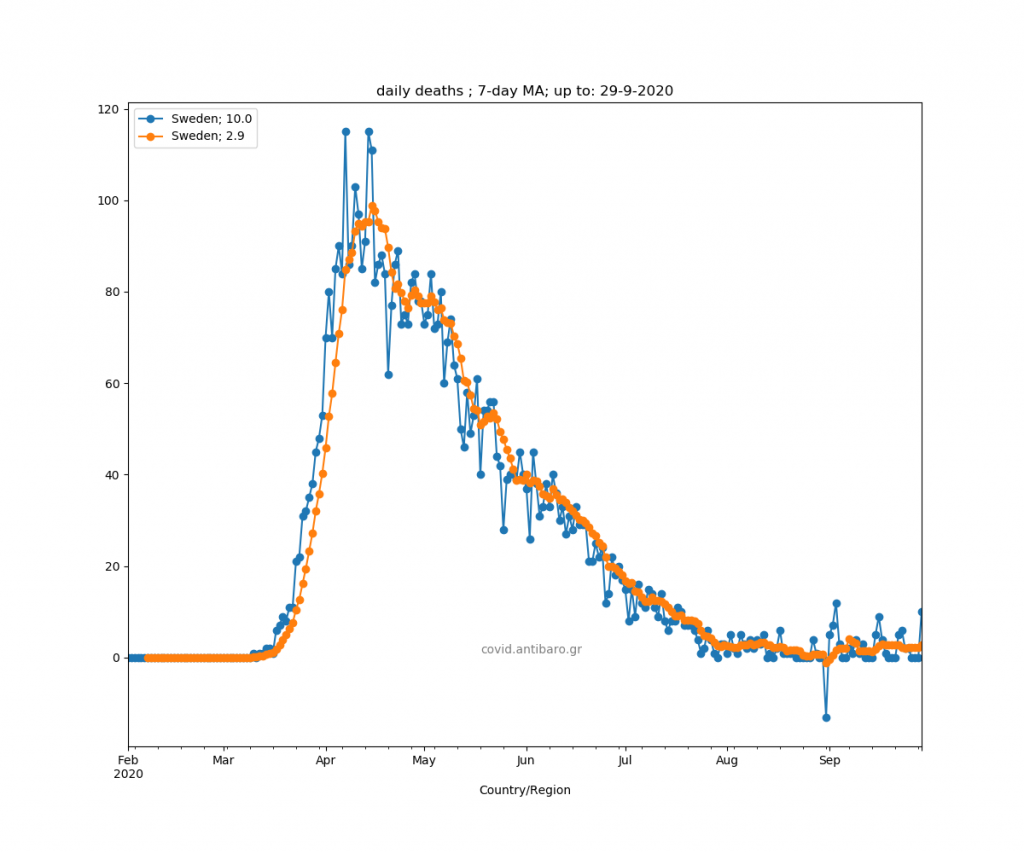
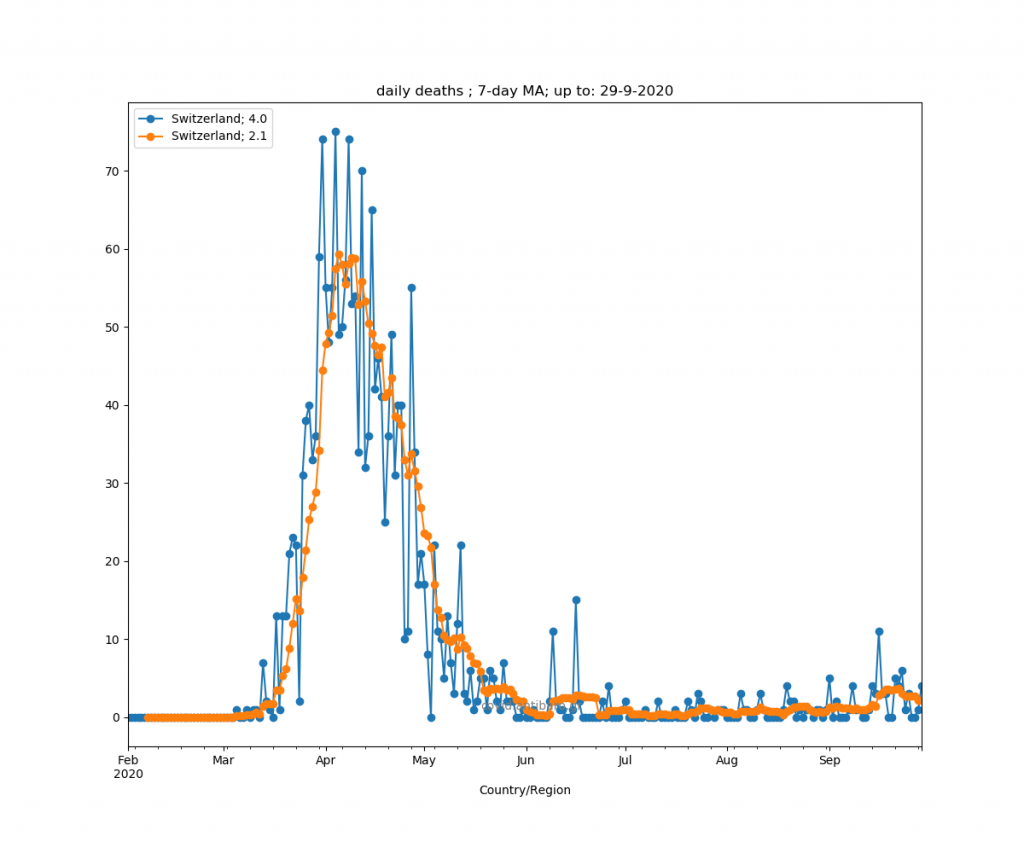
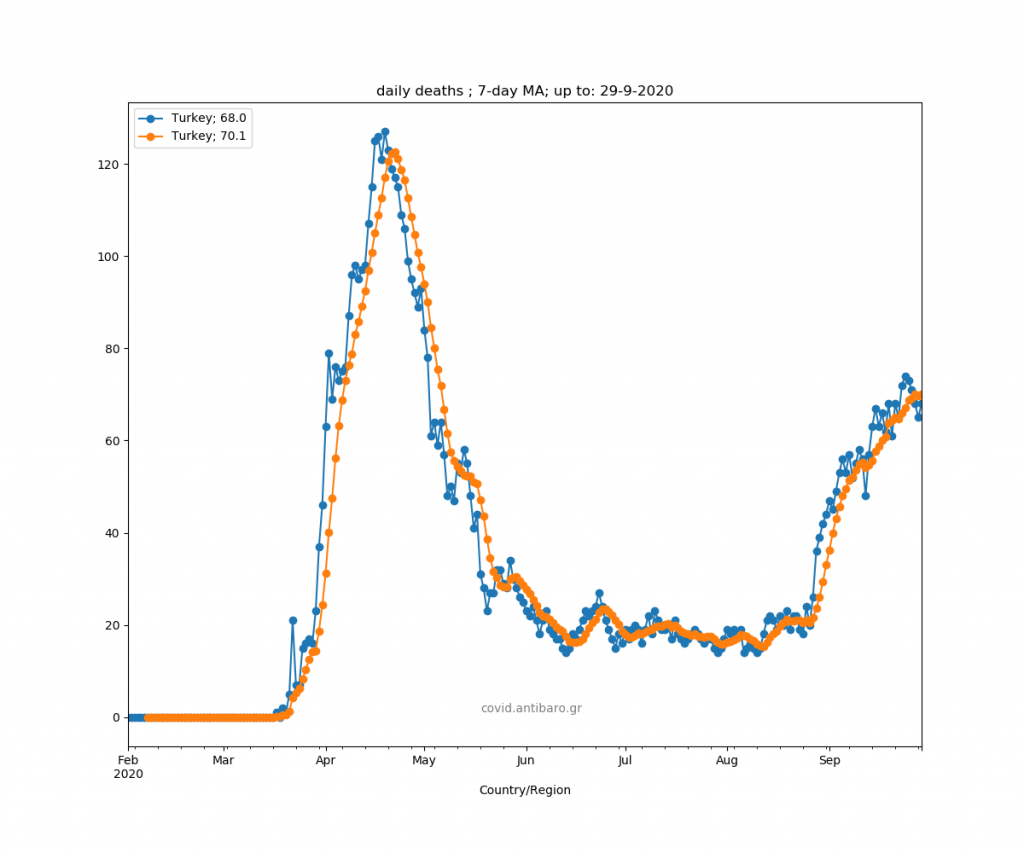
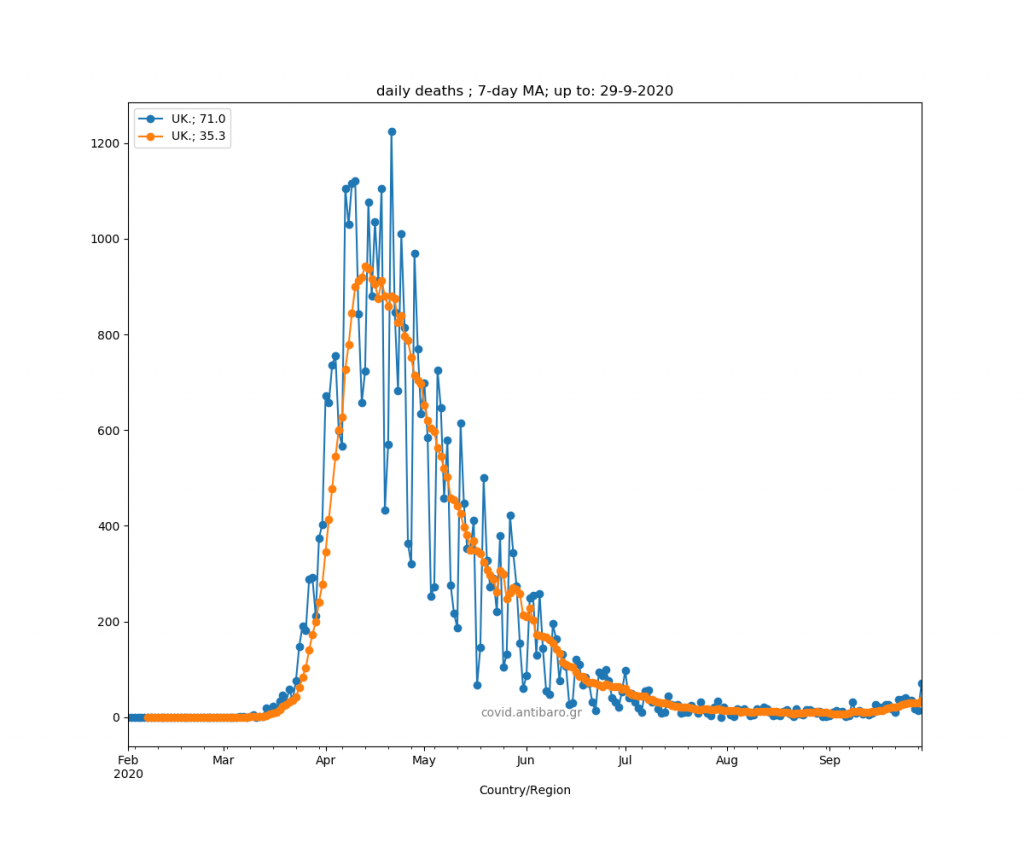
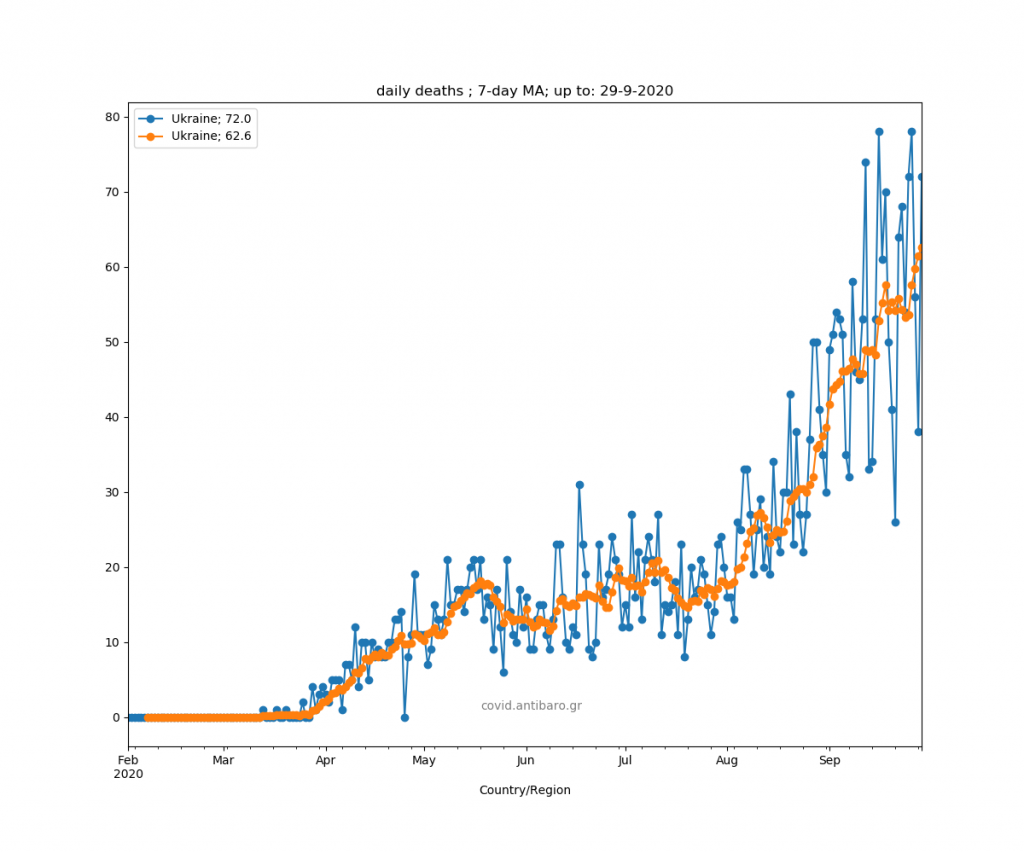
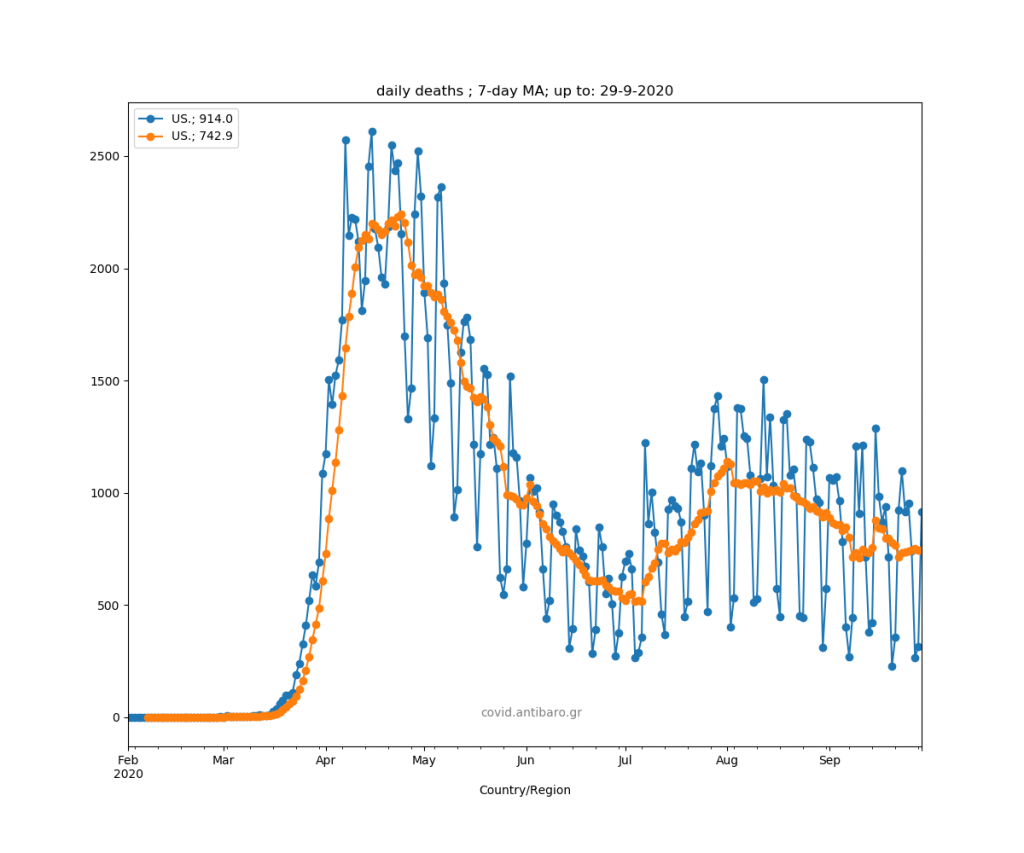
Daily deaths plus 7-day average for 42 countries in alphabetical order. Blue is the daily value, orange is the 7-day moving average. In the legend, you see the latest values, as of 29th Sep 2020
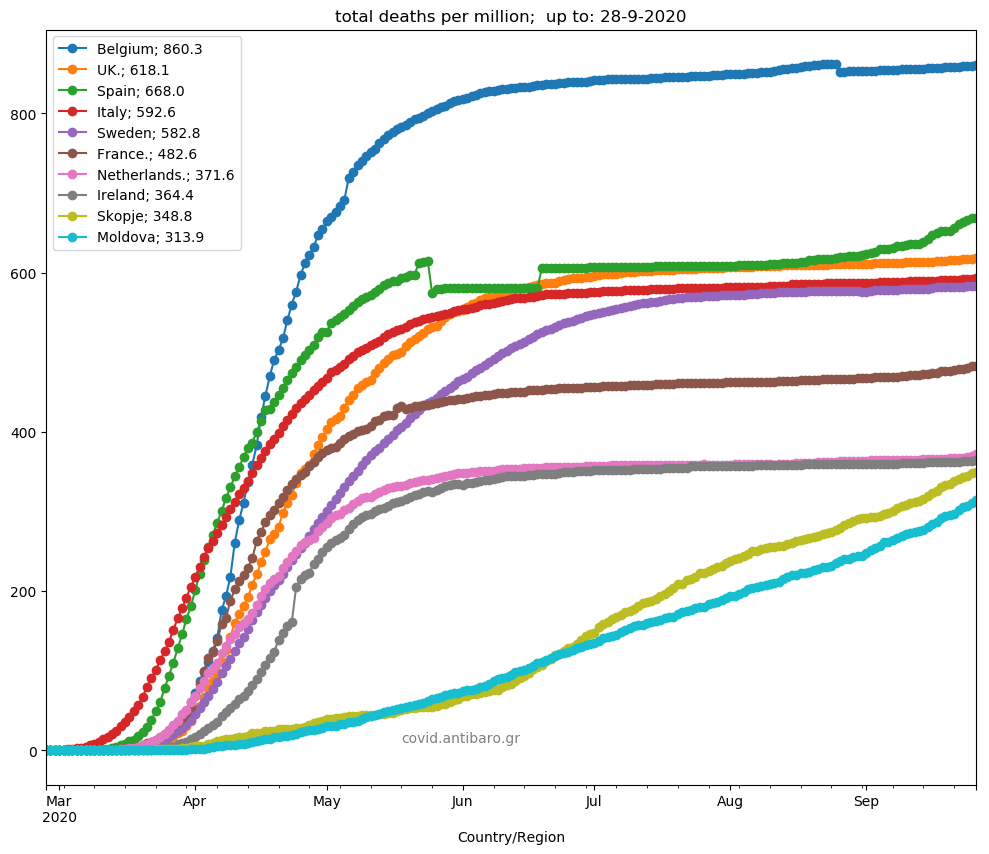
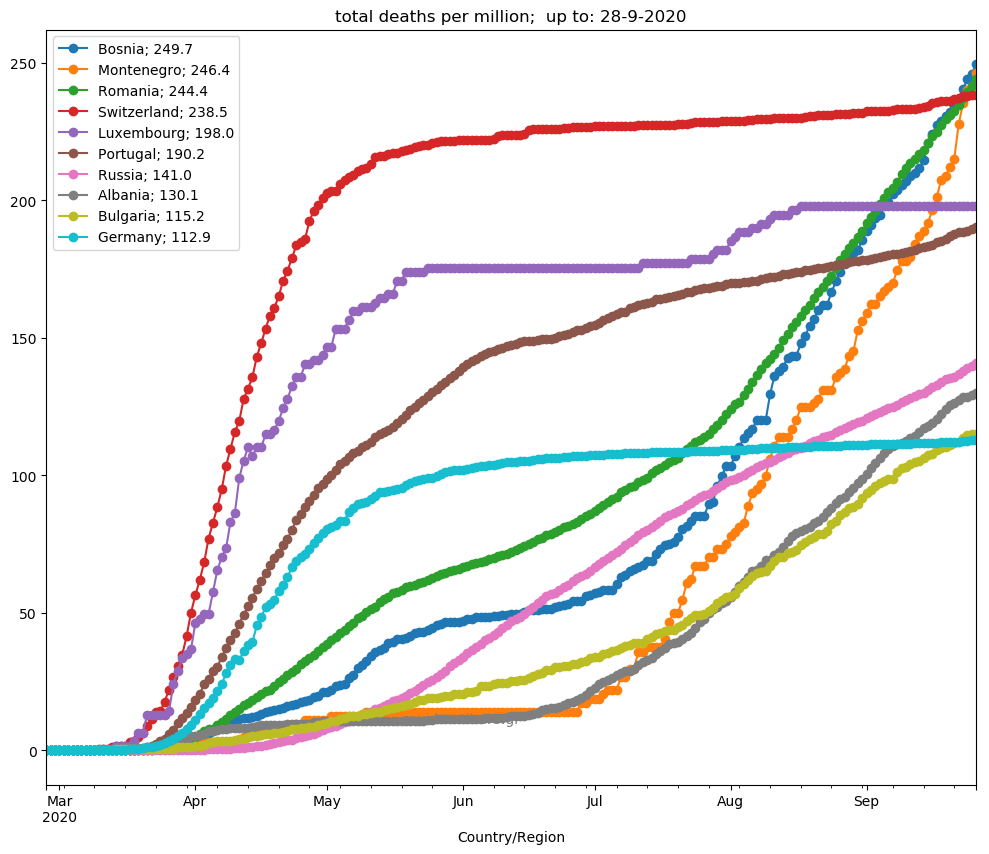
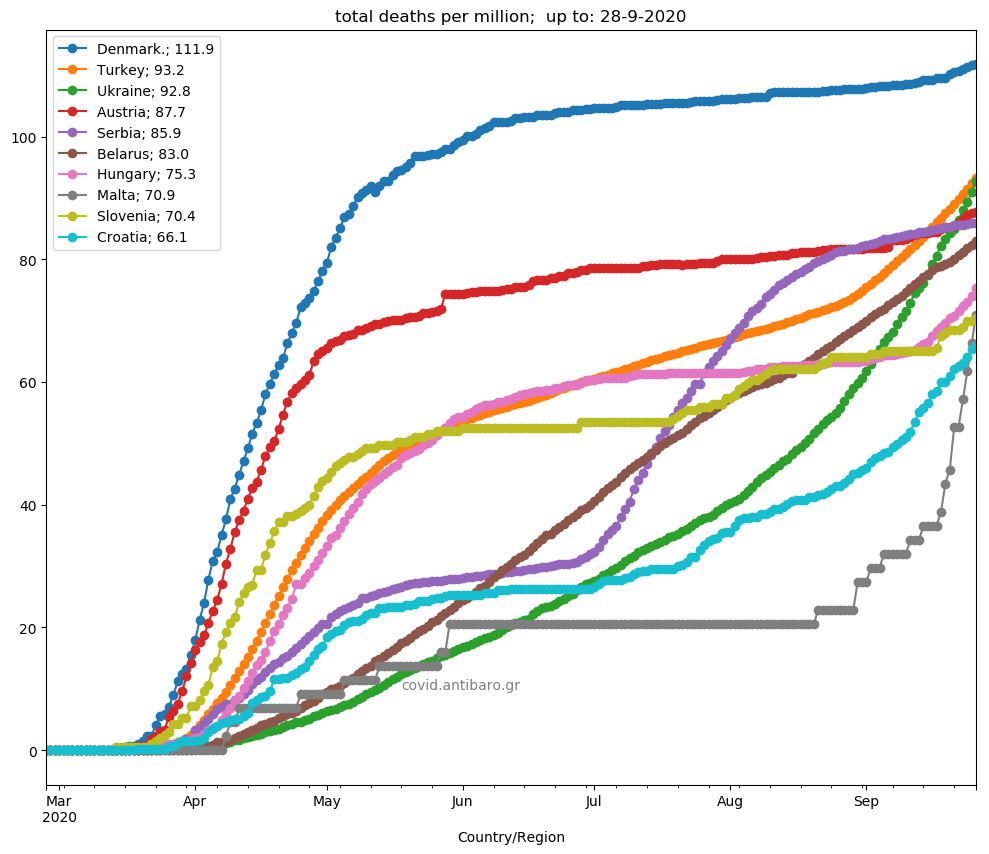
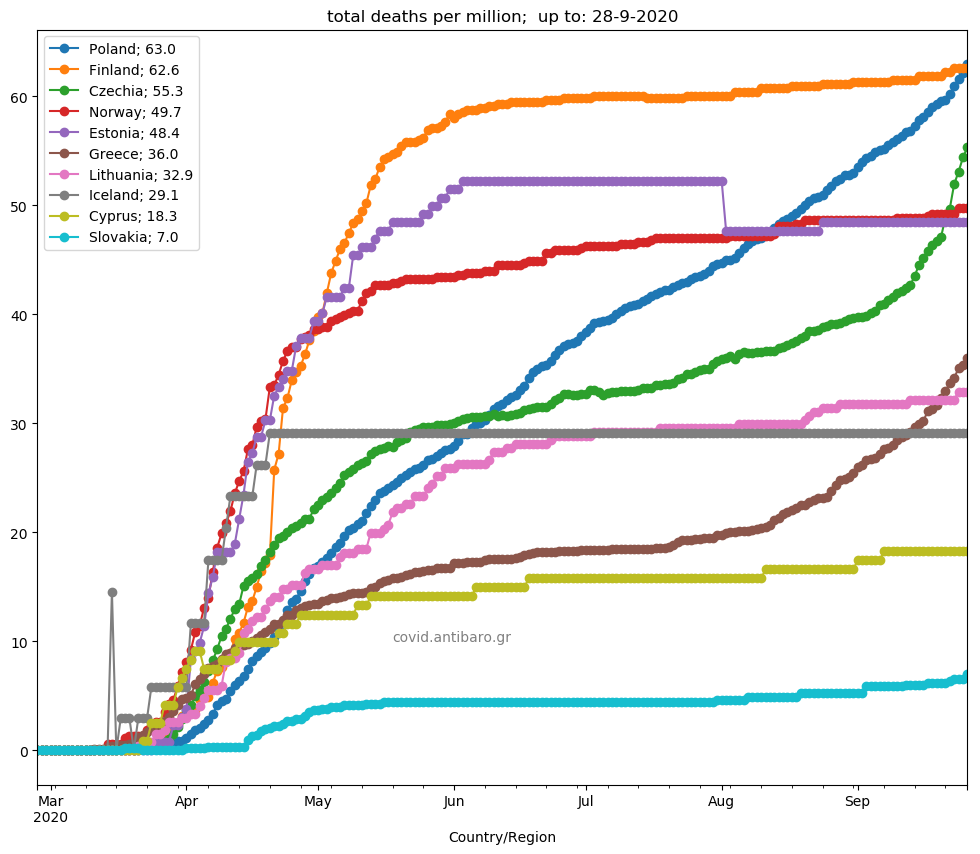
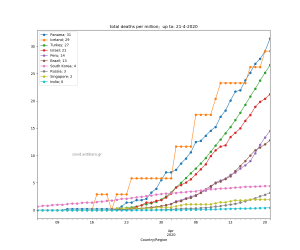
European top-40 of deaths / million, in four graphs: top10, top10-20, top20-30 and top30-40