
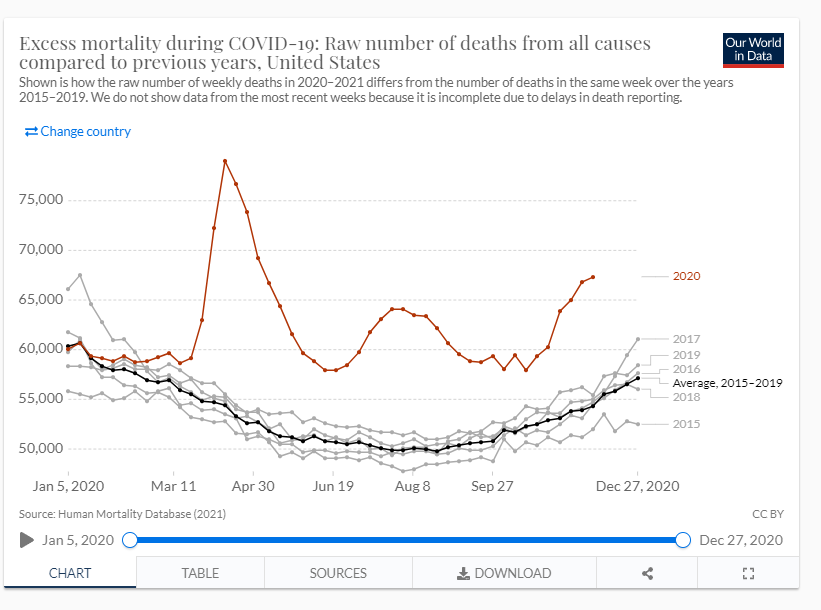
Update 19.1.2021.
US excess mortality around 400,000 in 2020, due to covid-19. Source (NYT)

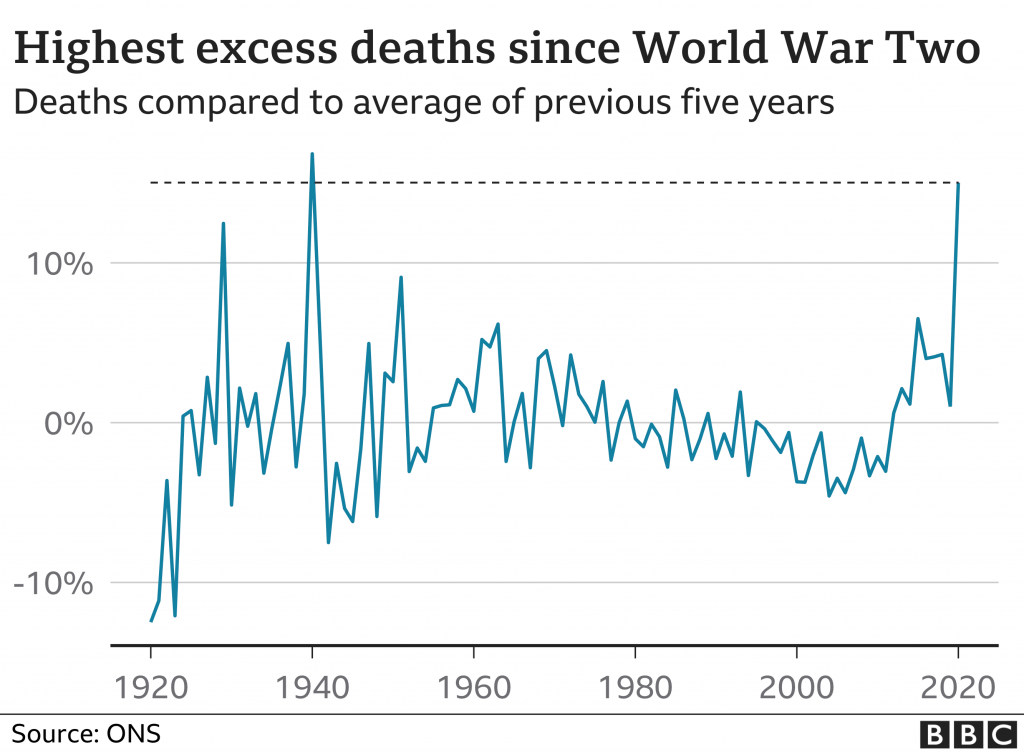
Update 14.1.2021 The UK announced excess mortality rate for 2020. It was 14%, the highest since 1940 of the WWII [link: BBC]. The 14% excess deaths in 2020 is very high, despite covid-related deaths occurred in 9.5 of 12 months of the year, as first deaths were registered around mid-March. Total deaths in 2020 were 697,000, which is nearly 85,000 more than expected for the year.
Also, here is a detailed report by Public Health England on excess mortality
Link with yearly number of deaths in Sweden.
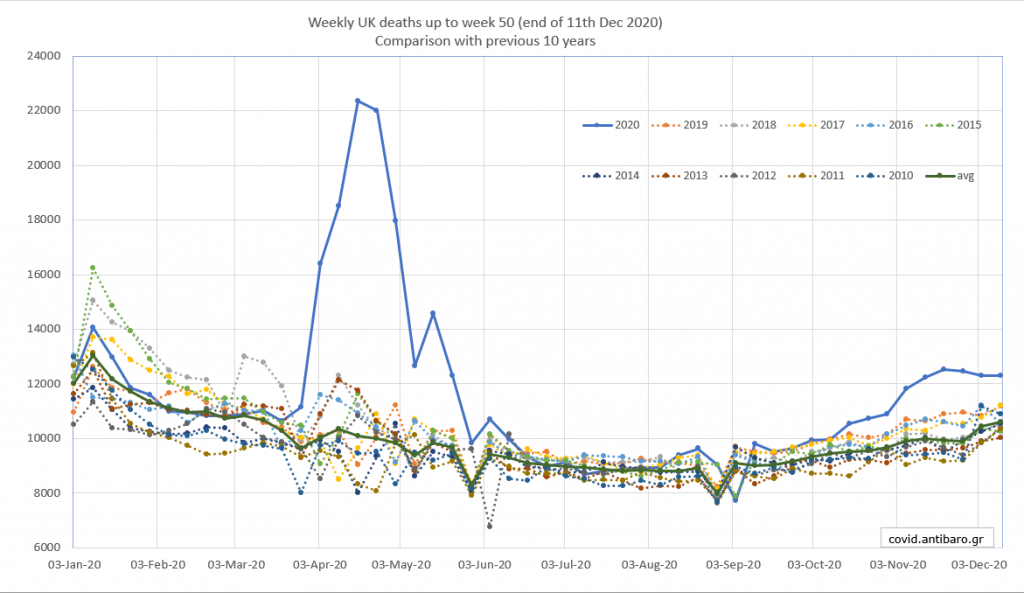
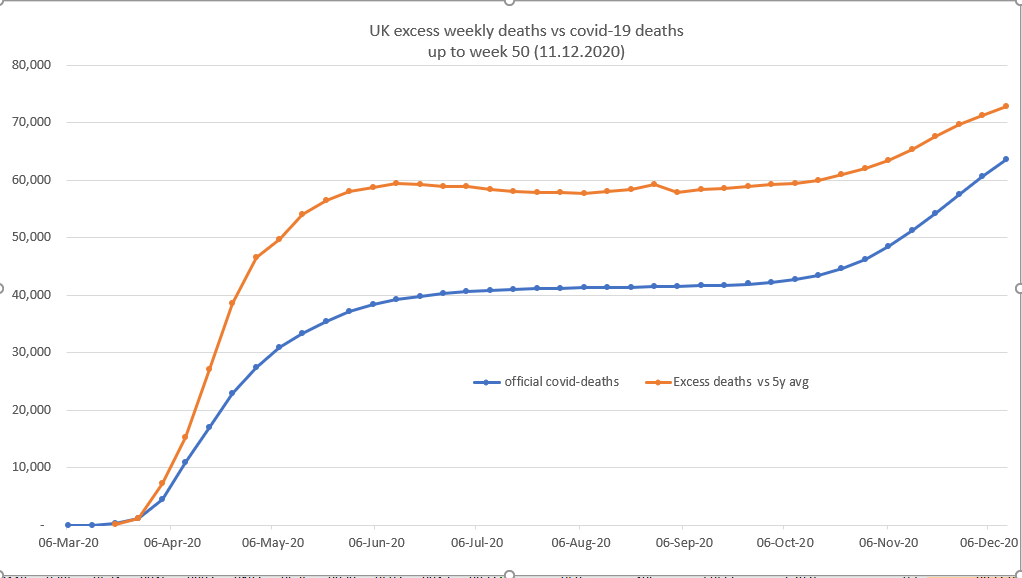
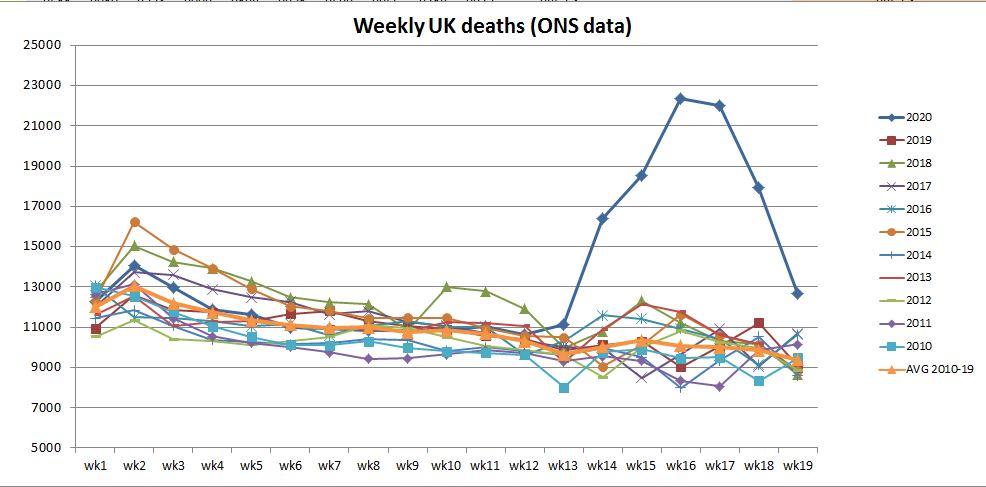
Update 22.12.2020. Data up to week 50, i.e. 11th Dec 2020. Source of data (Office for National Statistics, UK)

Update 3.6.2020: ONS update up to week 21, i.e. end of 22nd May. It is estimated:
- the difference between the surplus 2020 deaths from the 10y average, and the officially recorded covid-19 deaths to be around 23,300, and
- the difference between the suprlus 2020 deaths from the max of each one of the previous 10 years, and the officially recorded covid-19 deaths to be around 11,400
The officially recorded covid-19 deaths up to week 21 (22nd May 2020) was 36.393. So, in practice this comparison suggests that the real covid-19 related deaths could be between 47,800 and 59,700, using either the max of each of previous 10 years, or the mean of them.


Below are previous updates on the same topic.
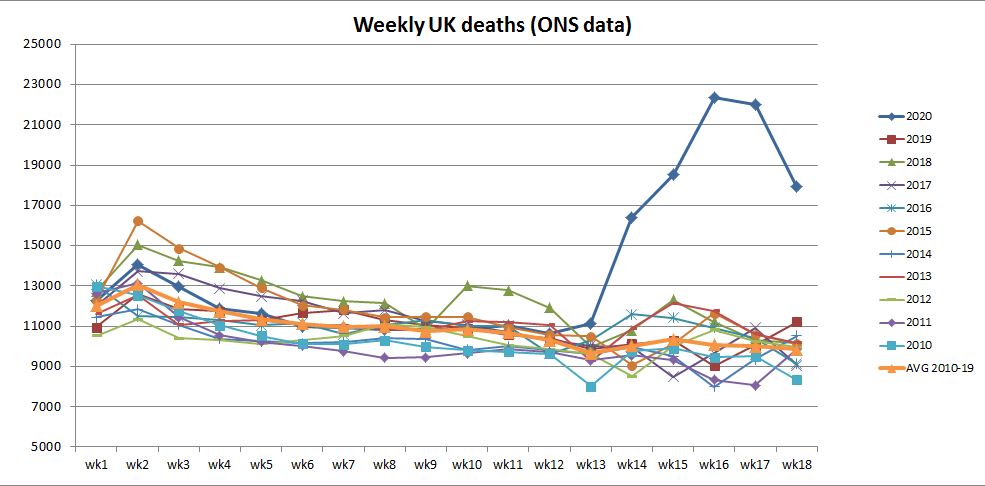
Update 20.5.2020: ONS update up to week 19.
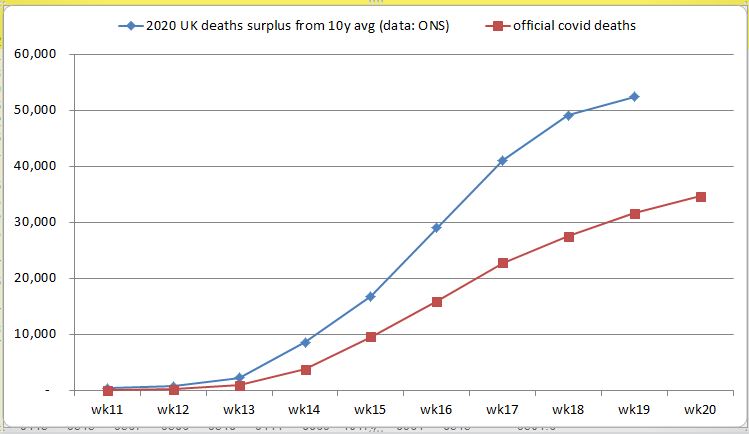
Update 14.5.2020: ONS updates up to week 18. Look at the charts below estimating the difference between surplus deaths in 2020 compared to 10y avg, with official covid-19 deaths. Latest difference around 21,000!

New Update 29.4.2020: The UK government revised deaths by adding more than 4000, coming from care homes. See this BBC news article for some information.
Update 29.4.2020: The FT editor Chris Giles says UK deaths to be revised from 21,678 (up to 28.4) to 44,000! This is based on the weekly data that ONS publishes, which have been discussed previously in this post. His tweets:
Update 28.4.2020: The Office for National Statistics published data for week 16 of 2020, ending 17th April 2020. Comparison between weekly 2020 deaths and average of previous 5 years as follows:
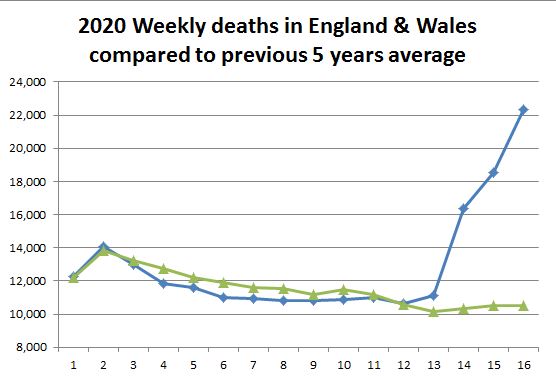
Increase of number of deaths per week:
week-13. 10%, 1011, out of which 539 officially linked to COVID-19 (53%)
week-14. 59%, 6082, out of which 3475 officially linked to COVID-19 (57%)
week-15. 76%, 7996, out of which 6213 officially linked to COVID-19 (78%)
week-16. 113%, 11854, out of which 8758 officially linked to COVID-19 (74%)
Update 26.4.2020. Excess weekly deaths in various European countries. Red line is 2020, grey is recent years average. Overall 114,000 deaths may have not been reported as COVID-19, related. Source, FT

Analysis done by Konstantinos Anagnostopoulos, Associate professor at National Technical University of Athens.
Summary:
| week | avg 2010-19 | 2020 | excess | increase in % |
| 13 | 9,647 | 11,141 | 1,494 | 15.5% |
| 14 | 10,019 | 16,387 | 6,368 | 63.6% |
| 15 | 10,345 | 18,516 | 8,171 | 79.0% |
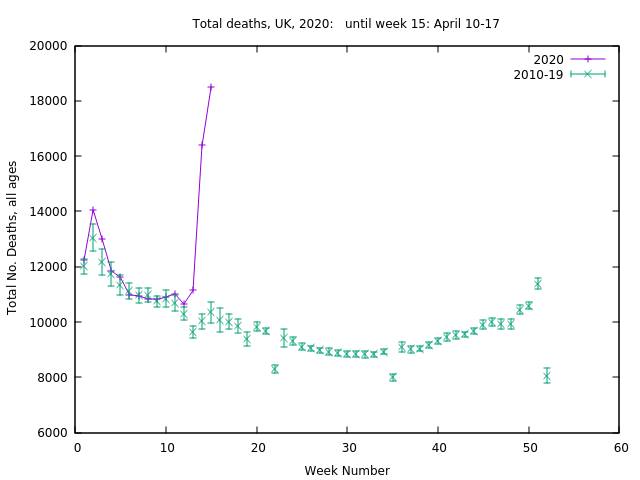
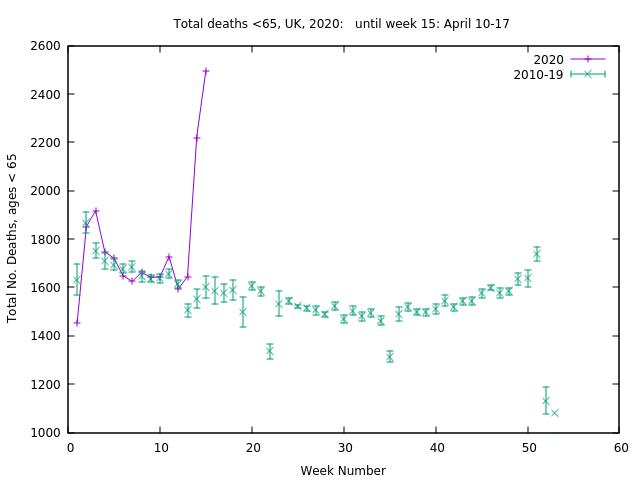
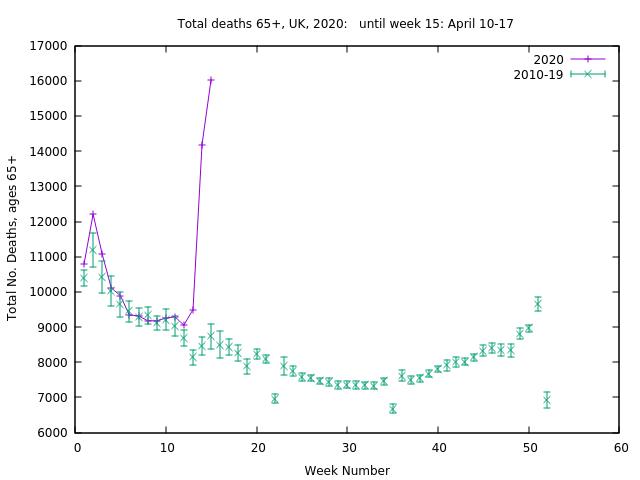
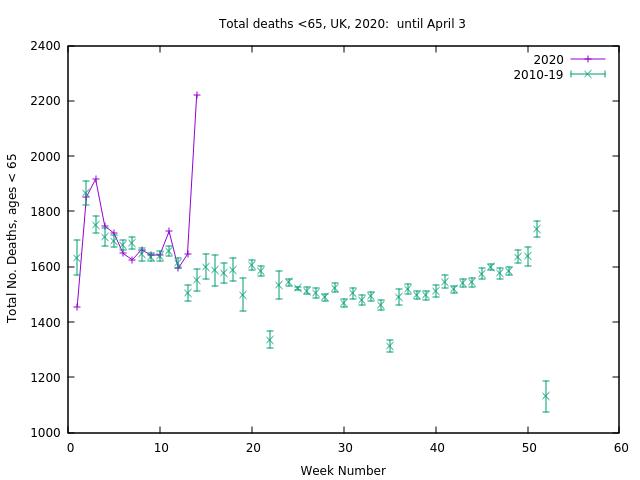
Update week 15 (4-10th April). A clear surge and an increasing number of deaths the last two weeks. Deaths even higher compared to average and +-1 sigma from the 10-year mean.
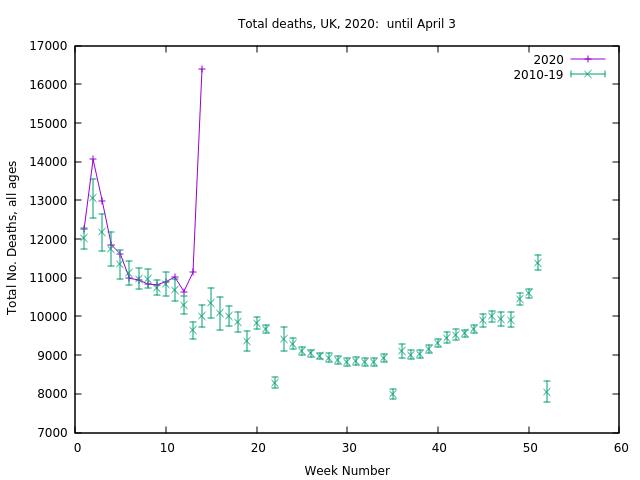
Total number of deaths in the UK 2020, up to week 14 (up to 3rd April)
A clear surge in total number of deaths the last week of data available.
The UK publishes the deaths registered weakly, which makes the reports of the number of COVID-19 deaths easier to interpret. All governments should do the same.

Data taken from here. Analysis file here
Huge number of covid-19 deaths may have been mis-reported in the UK; BBC Newsnight video.
Related to the above analysis.
BBC Newsnight video shows evidence that out of 6078 additional deaths in the week of 3rd April 2020, on top of the average over the last five years of the corresponding week, only 3475 of them were reported as COVID-19 related.
The rest 2607 of them were not, but in fact they could be related to the pandemic. If true, it would mean that only around 60% of the deaths were included in the official report. [ Source ]
Professor of Mathematics at the University of Cambridge David Spiegelharter speaks to the BBC:
Similar analysis by the New York Times show that up to around 10-12th April, there were about 28,000 deaths missing from the official reports.
Similar analysis by the BBC with interesting graphs


Note added:
Care should be taken in making a fast interpretation, because of the following complications:
1. There are 2500 “unexplainable deaths”. This could be from people dying at home because they don’t want to go to hospital, suicide or domestic violence
2. There is a possibility that the virus kills people that had extremely short life expectancy (Ioannidis). If this is the case, then the surge will be followed by a plummet.